Introduction
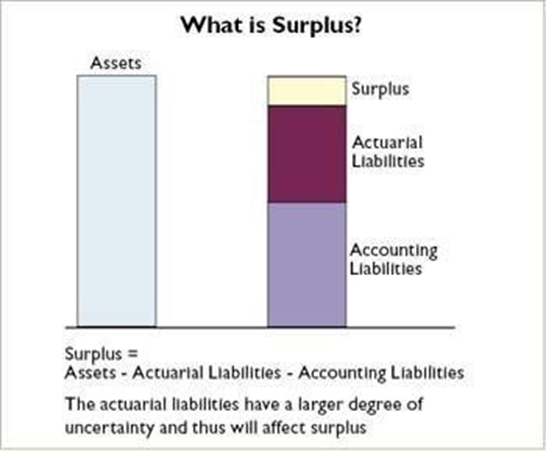
In our last lesson, we established the critical distinction between economic surplus (a market-consistent measure of "true" value) and accounting surplus (a regulated, reported figure). We defined surplus as the difference between assets and liabilities, representing a company's financial buffer.
Today, we move from a static picture to a dynamic one. A company's surplus doesn't stand still; it changes over the course of a year due to business activities. This lesson focuses on the technique used to dissect that change: the Analysis of Surplus, also known as Source of Earnings (SOE) analysis. We will learn how to break down the overall change in surplus to identify the precise drivers of profit and loss. This process is one of the most powerful diagnostic tools in an actuary's toolkit, turning raw financial results into actionable management information.
The Purpose and Principle of Surplus Analysis
At the start of a financial year, an insurer has an opening surplus. At the end of the year, it has a closing surplus. The core question of surplus analysis is: what happened in between?
The goal is to reconcile the opening and closing surplus by breaking down the change into its constituent parts. This provides crucial feedback to management on questions like:
- Were our pricing assumptions correct?
- How did our investment strategy perform against expectations?
- Are there unexpected trends in claims or policyholder behaviour?
- Which business lines are most profitable and why?
The fundamental principle is to compare the actual experience over the period with the expected experience that was assumed at the start of the period.
The change in surplus can be expressed as:
- Planned Profit: The profit we expected to earn based on the assumptions used in our pricing and reserving at the start of the year.
- Experience Variances: The gains or losses arising from the differences between our actual experience and those starting assumptions. This is the heart of the analysis.
- Other Movements: Can include capital injections, dividend payments, or changes in reserving methodology.
To begin, let's look at the two primary engines of an insurer's profitability.
Insurance Companies: How they make money | Primerli
This video from Primerli provides a clear, high-level overview of the two main ways an insurance company makes money. This gives us the top-level categories for our analysis.
Watch the video from the beginning until the end. Pay close attention to the distinction between underwriting income (profit from the insurance risk itself) and investment income (profit from investing premiums). These form the two main branches of our surplus analysis.
Decomposing the Sources of Profit and Loss
As the video illustrates, an insurer's profit comes from its core insurance operations (underwriting) and its investment activities. The Experience Variance can therefore be split along these lines, and then broken down even further.
An excellent, though very detailed, paper on this topic is "Source of Earnings Analysis for Property-Casualty Insurers" from the Casualty Actuarial Society. While its focus is on P&C, the principles are universal. It defines SOE analysis as a reporting structure that reveals these sources of gain and loss.
Here are the main sources of profit or loss that are typically examined:
-
Investment Experience:
- Source: The return earned on the company's assets.
- Analysis: Compares the actual investment return achieved against the return assumed in the pricing and valuation basis. A positive variance means assets performed better than expected, contributing to surplus. A negative variance means they underperformed.
-
Underwriting/Insurance Experience: This is a broad category that is further subdivided:
- Mortality/Morbidity: Did claim numbers from death or sickness differ from what was expected? If fewer people claimed than assumed, this generates a mortality profit.
- Expenses: Were the actual costs of running the business (e.g., salaries, IT, commissions) higher or lower than the expense assumptions? Lower-than-expected expenses generate an expense profit.
- Persistency (Lapses/Withdrawals): Did more or fewer policyholders surrender their policies than expected? The impact of this is complex. If a policy lapses early, the insurer no longer has to pay future claims, but it also loses future premium income and the ability to recoup initial setup costs. The net effect could be a profit or a loss, depending on the product design and how long the policy was in force.
- New Business: The act of writing new business often creates an initial loss, known as new business strain. This is because high upfront costs (like agent commissions and underwriting expenses) are paid before much premium has been earned. The analysis quantifies the difference between the expected strain and the actual strain incurred.
-
Changes in Actuarial Assumptions & Models:
- Sometimes, the actuary decides to change the underlying assumptions used for valuation (e.g., updating mortality tables or changing the long-term investment return assumption).
- These changes directly impact the calculated value of liabilities. An increase in liabilities will cause a direct decrease in surplus, and vice versa. This is not a variance from experience, but a variance from a change in the measurement basis itself.
The following video discusses this effect from the perspective of a reserving actuary.
Actuarial Pricing vs Reserving: Something no one talks about
This video by Actuary Elle provides great intuition on how changes in liability estimates, driven by the reserving actuary, affect the company's reported profit and thus its surplus, even if the "true" underlying cost of claims hasn't changed.
Please watch from this segment. The key idea is that the actuary's choice of reserves (e.g., setting them at $80 million vs. $100 million) directly creates a reported gain or loss, impacting the surplus. This is a critical "source" of change.
A Framework for Analysis: Estimation vs. Process Error
When we find a variance—for example, actual claims were higher than expected—it's crucial to understand why. Given your background in statistics, you'll appreciate this next distinction, which is fundamental to a rigorous surplus analysis. Any variance can be split into two components: estimation error and process error.
- Estimation Error: This means our original assumption (the parameter of our model) was wrong. For example, we assumed an underlying mortality rate of 1%, but the true rate for the population was actually 1.1%. This is a systematic error in our forecast that we can correct in the future.
- Process Error: This means our original assumption was correct on average, but random fluctuation led to a different outcome in this specific period. For example, we correctly assumed a 1% mortality rate, which implies 10 deaths in a group of 1,000, but by sheer chance, 11 people died. This is statistical noise, not a flaw in the assumption.
Distinguishing between these two is vital. Estimation error signals that our pricing or reserving basis needs to be revised. Process error is an expected and unavoidable part of the insurance business, and it is the reason an insurer needs to hold surplus in the first place.
The following reading explains this concept clearly.
[PDF] Source of Earnings Analysis for Property-Casualty Insurers
This section of the CAS paper introduces and explains the vital distinction between estimation error and process error using a practical example of loss cost trends.
Please read the section starting from the introduction to the concept. Focus on understanding how the total variance is decomposed into these two types of error.
The Structure of the Analysis
In practice, the analysis is often presented in a table that tracks each source of profit from what was charged or expected to what was actually realized.
The CAS paper provides excellent examples of how this is structured. While the details are for P&C insurance, the format is general. For each earnings factor, the analysis moves through three stages:
- Charged/Expected: The implicit or explicit profit margin assumed in the original pricing/valuation.
- Revised Expected: An updated expectation based on hindsight (e.g., we now know what the actual market interest rates were for the year). The difference between #1 and #2 often reflects the estimation error.
- Actual: The final realized result for the period. The difference between #2 and #3 often reflects the process error.
Let's look at how this is laid out in a table.
[PDF] Source of Earnings Analysis for Property-Casualty Insurers
This part of the paper provides a clear, practical example of how the analysis is structured in tables, showing the movement from charged, to expected, to actual results over time.
First, read the section "Charged, Expected, and Actual", paying attention to Tables 7A, 7B and 7C which show how the variance evolves as more information becomes available. Then, review Table 8 under the heading "Combining the Earnings Factors". This table is a superb example of a full analysis, bringing together all the different sources of profit/loss into a single, comprehensive view.
Conclusion
In this lesson, we have moved from defining surplus to analyzing its movement. The Analysis of Surplus is a powerful actuarial technique that decomposes the change in a company's surplus into its underlying drivers. By comparing expected results with actual experience, it provides invaluable feedback on pricing accuracy, investment performance, and policyholder behaviour.
We established that the main sources of profit and loss are derived from investment experience and underwriting experience, with the latter being broken down into mortality/morbidity, expenses, and persistency. We also saw that changes in the actuary's own assumptions can be a significant driver of surplus changes. Finally, we introduced the sophisticated but critical distinction between estimation error and process error, which helps determine whether a deviation from expectation was due to a faulty assumption or simple random chance.
In our next lesson, we will see how the results of this analysis are used. We will discuss the form and content of key actuarial reports, such as the Actuarial Function Report and the Financial Condition Report, where the insights from the analysis of surplus are formally documented and communicated to management, boards, and regulators.
Key Takeaways & Cheatsheet
| Source of Surplus Change | Description | Profit or Loss? |
|---|---|---|
| Investment Profit/Loss | Actual investment returns were different from the assumed rate. | Profit: Actual > Assumed. Loss: Actual < Assumed. |
| Mortality/Morbidity Profit/Loss | Actual claims from death/sickness were different from expected. | Profit: Actual < Expected. Loss: Actual > Expected. |
| Expense Profit/Loss | Actual expenses were different from the allowance in pricing. | Profit: Actual < Expected. Loss: Actual > Expected. |
| Persistency Profit/Loss | Actual policy lapses were different from expected. | Complex. Can be profit or loss depending on timing and product. |
| New Business Strain | Actual cost of writing new business was different from expected. | A larger-than-expected strain is a "loss" relative to plan. |
| Assumption Changes | Actuary changes the valuation basis (e.g., strengthens reserves). | Loss: Strengthening reserves (increasing liabilities). Profit: Releasing reserves (decreasing liabilities). |
| Model Changes | A change in the actuarial model used for valuation. | Can be profit or loss, depending on the impact on liabilities. |
| Other Items | External capital injections, dividends paid to shareholders, tax. | Varies. Dividends are a planned reduction in surplus. |