Introduction
Hello and welcome back. In our last lesson, we explored optimistic updates, a UX pattern that enhances perceived speed by updating the interface before getting server confirmation. We saw the power of this pattern but also the risks it introduces, especially the jarring experience of a rollback when the system's optimism is misplaced. This highlighted a core challenge in system design: managing the user's perception of the system's state and maintaining their trust.
Today, we will address this challenge directly by focusing on transparency. Instead of hiding the state of our data, we're going to learn how to communicate it clearly and effectively. The goal of this lesson is to equip you to design UI patterns for data freshness indicators on a dashboard (e.g., 'last updated' timestamps). As a UI/UX designer, mastering these patterns will enable you to architect interfaces that users find both informative and trustworthy.
1. Why Data Freshness Matters: Beyond "Real-Time"
Before diving into specific UI patterns, it's crucial to understand the strategic thinking behind them. The assumption that all data on a dashboard must be "real-time" is a common and costly trap. As a system architect, your role is to balance user needs with technical feasibility and cost. Not all data is created equal, and communicating its timeliness is a fundamental aspect of good design.
An excellent starting point is to categorize data based on how current it needs to be. This helps you make deliberate design decisions instead of defaulting to the most complex and expensive option.
UI/UX Strategies: How Smart Interface Design Prevents Backend ...
The following article, 'UI/UX Strategies: How Smart Interface Design Prevents Backend...', offers a superb framework for this. It explains how to categorize data by its freshness needs and debunks the 'real-time everything' myth.
Please read the section 'Strategy 3: Intelligent Data Freshness Requirements' (up to the heading 'Strategy 4') and the section 'Common Pitfalls and Anti-Patterns'. Focus on the three categories of data freshness and the 'Real-Time Everything' trap.
As the article highlights, treating every piece of data as "real-time critical" leads to immense backend load and infrastructure costs. By categorizing data into real-time critical, near real-time acceptable, and periodic updates sufficient, you can tailor your UI to serve the user's actual needs efficiently. A user checking their bank balance after a transfer needs real-time confirmation, but when reviewing a monthly spending report, data that is a day old is perfectly acceptable.
Communicating this freshness isn't just a technical detail; it's a core component of user trust. When users understand when their data was last updated, they can make better decisions and have more confidence in the system.
2. Core UI Patterns for Communicating Freshness
Now that we have the "why," let's explore the "how." There are several established UI patterns for displaying data freshness. Your task as a designer is to choose and combine them effectively based on the context.
Pattern 1: The Timestamp
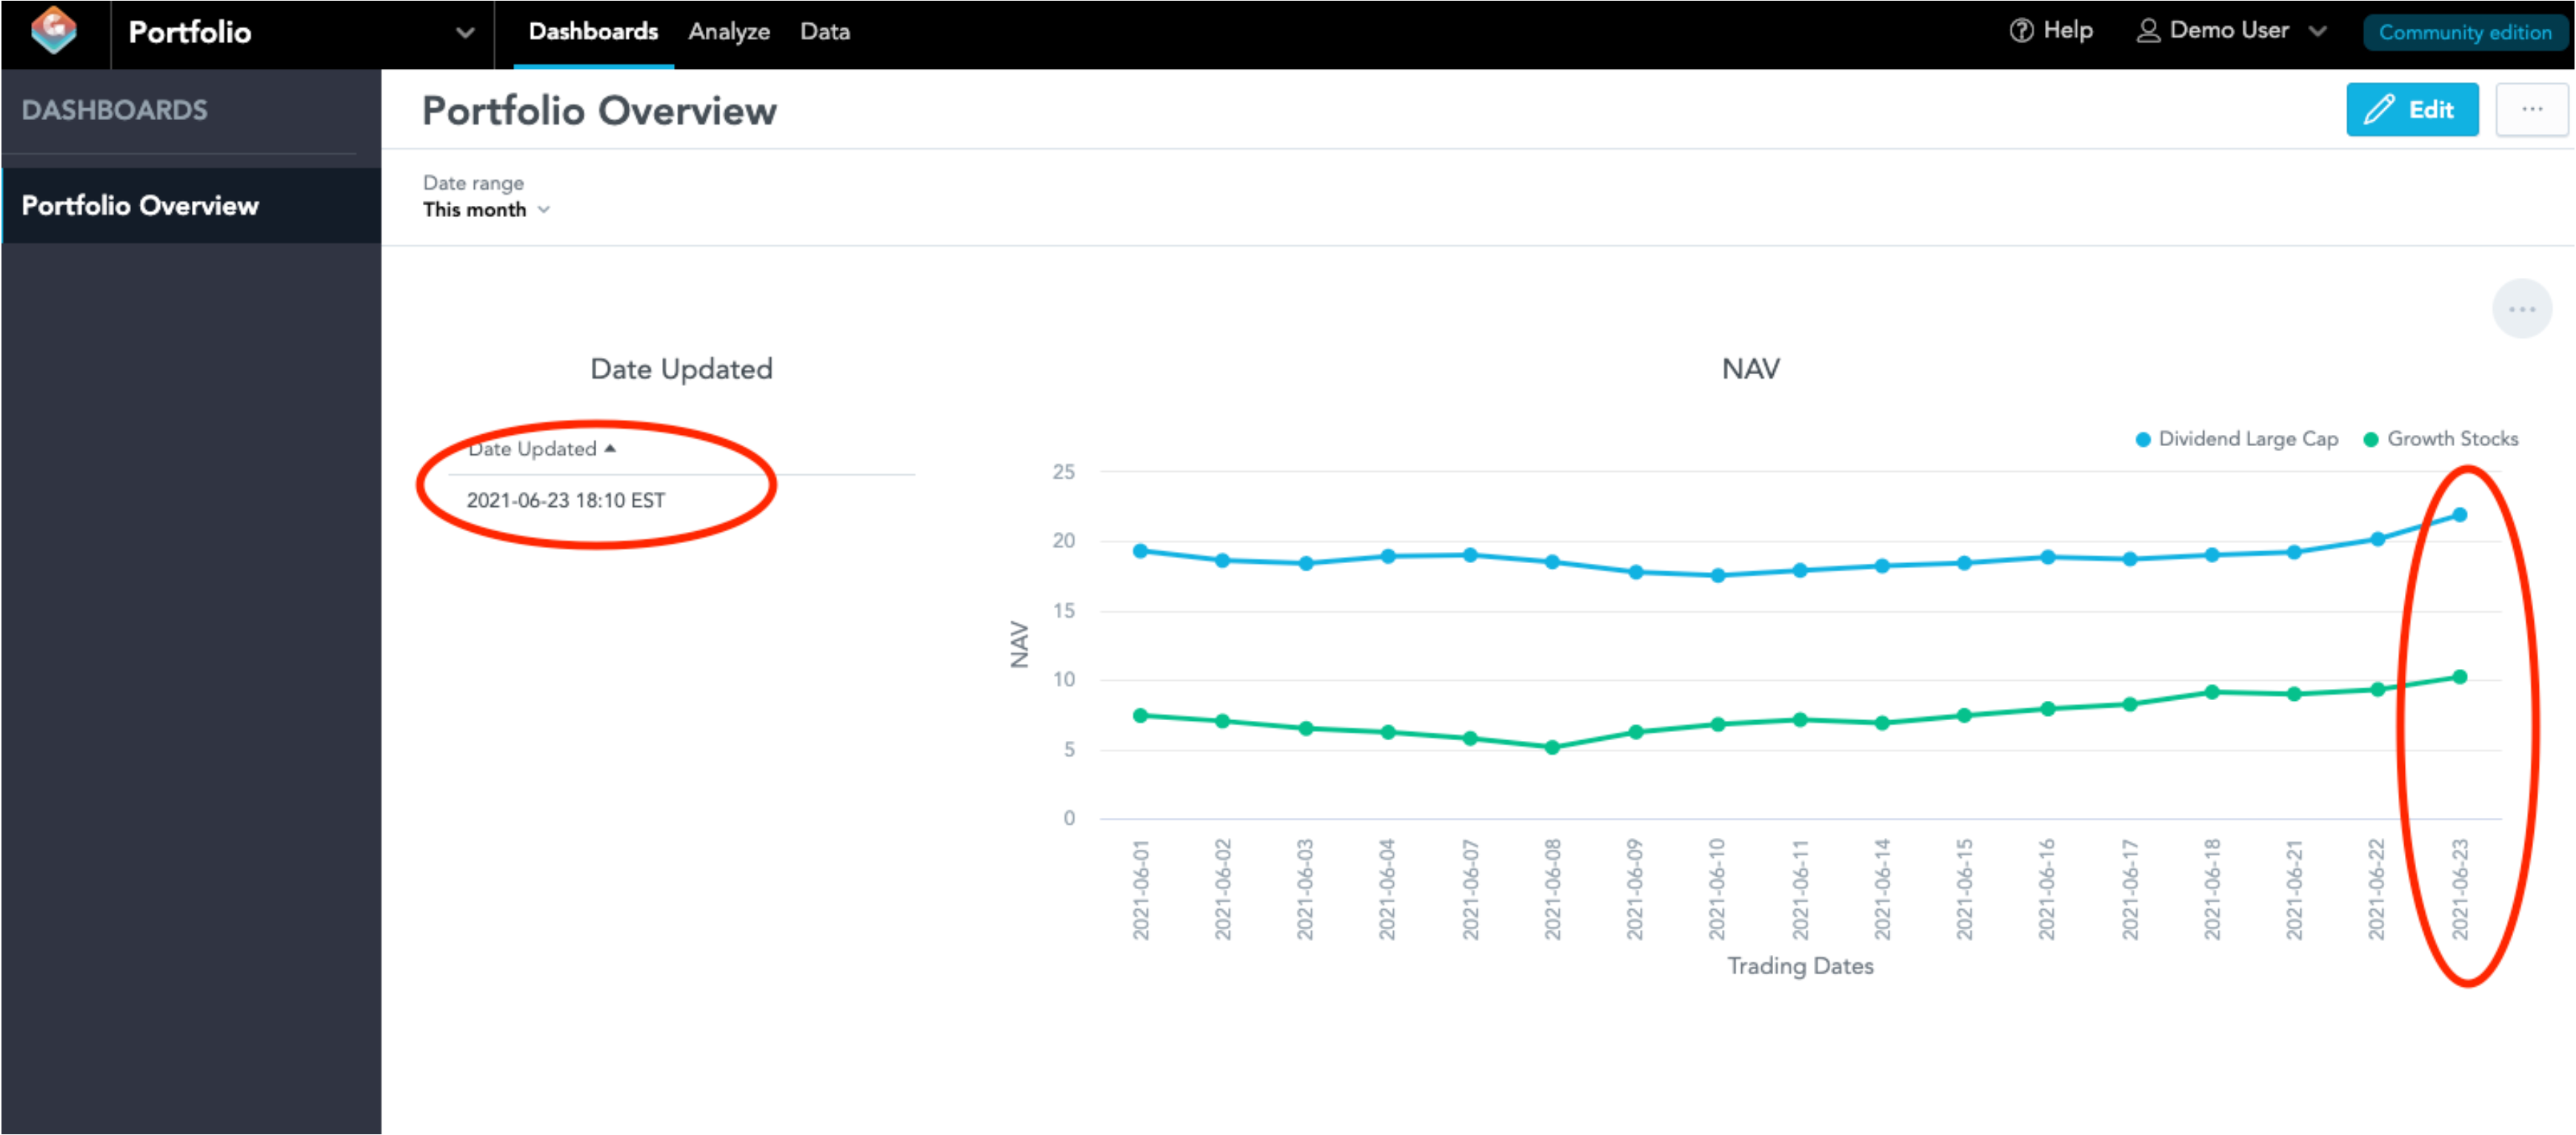
The most direct method is the timestamp. It explicitly states when the data was last fetched or calculated. This can be an absolute timestamp (e.g., "June 23, 2021, 18:10 EST") or a relative one (e.g., "Updated 3 minutes ago").
- Absolute Timestamps: Excellent for precision and for data that has a long shelf-life. They are unambiguous and ideal for auditable or historical data.
- Relative Timestamps: Great for conveying immediate currency and for data that updates frequently. "Updated just now" feels more alive than a full timestamp.
Here is a clear example from a financial portfolio dashboard, a context where data timeliness is critical.
Pattern 2: Status Indicators & Manual Refresh
While timestamps provide detail, sometimes users need a quicker, at-a-glance signal. Status indicators (like colored dots or icons) can communicate the general state of the data:
- A green dot might mean "Live" or "Up to date."
- A yellow or amber icon could signal "Delayed" or "Syncing."
- A red icon can warn of "Offline" or "Stale data."
These indicators are often paired with a manual refresh button. Even in auto-updating systems, providing a refresh button gives users a sense of control and agency, allowing them to force an update if they feel the data might be stale.
This combination of patterns forms a powerful, compact component. Let's read about how these elements are integrated into a single "Data Freshness Indicator."
From Data To Decisions: UX Strategies For Real-Time Dashboards
The article 'From Data To Decisions: UX Strategies For Real-Time Dashboards' by Smashing Magazine describes a practical widget that combines these patterns effectively.
Please read the section 'Data Freshness Indicator' and the 'Final Takeaways'. Notice how the widget described combines status, time, and user control. The takeaways reinforce why this is a 'Do' in dashboard design.
The "Data Freshness Indicator" widget is a perfect example of a design pattern that serves both the user's need for clarity and the system's need for transparency.
3. Design in Context: Global vs. Per-Widget Indicators
Where you place these indicators is as important as what they look like. You have two main choices:
-
Global Indicator: A single indicator, usually in the dashboard's header, that applies to all the data shown. This works well when all the data on the dashboard comes from the same source and refreshes at the same time.
-
Per-Widget (or Per-Metric) Indicators: Each chart, table, or KPI on the dashboard has its own freshness indicator. This is essential for complex dashboards that aggregate data from multiple systems with different update cycles. For example, a sales dashboard might show real-time transactions alongside a weekly sales forecast. Each needs its own indicator.
Your background in creating scalable UI components is directly applicable here. You can design a flexible "freshness component" in Figma with variants for different states (live, delayed, stale) and contexts (global, widget-level) that can be reused across your system.
Your Turn: A UX Design Challenge
Now, let's apply these concepts to a practical scenario. Imagine you are designing a dashboard for a logistics company that manages a fleet of delivery vehicles.
The dashboard has three main widgets:
- A map showing the live location of delivery trucks. This data is critical and updates every 15 seconds.
- A chart showing the total number of packages delivered today. This data is important for shift managers and updates every 5 minutes.
- A table summarizing delivery performance and efficiency for the past week. This is for high-level analysis and is generated once daily overnight.
Your Task:
For each of the three widgets, describe the UI pattern(s) you would use to communicate its data freshness. Explain why you chose that pattern, connecting your reasoning back to the data's category (real-time critical, near real-time, etc.) and the likely needs of the user looking at it.
Consider the following in your answer:
- Timestamps (absolute vs. relative?)
- Status indicators (icons, colors?)
- Manual refresh controls (needed or not?)
- Placement and visibility of the indicator.
Think about how your design choices help the user trust the data and use it appropriately.
Conclusion
In this lesson, we moved from the risks of implicit data states to the benefits of explicit communication. You learned that being transparent about data freshness is a cornerstone of building user trust and designing effective decision-support systems.
Key Takeaways:
- Categorize Data: Not all data needs to be real-time. Classifying data by its required freshness (real-time, near real-time, periodic) is a key architectural decision that impacts both UX and cost.
- Use Proven Patterns: Timestamps, status indicators, and manual refresh controls are fundamental UI patterns for communicating data freshness.
- Combine and Contextualize: The most effective solutions often combine these patterns into a single component (like a "freshness widget") and apply them contextually (globally or per-widget) based on the dashboard's data sources.
- Design for Trust: The ultimate goal of these patterns is to manage user expectations, prevent decisions based on stale data, and build an experience that feels reliable and transparent.
Next Steps
We've now covered how to show that data is fresh. But what happens when the system fails to update and the data becomes significantly delayed or stale? Simply showing "Updated 3 hours ago" on a real-time chart isn't enough; it's an error condition that requires a more active response.
In our next lesson, we will tackle this problem directly. We will learn how to design user-facing alert patterns for significant data delay scenarios, ensuring the user is not just informed, but actively warned when data integrity is compromised.