Hello! Welcome back to our course.
In our last few lessons, we've assembled the essential building blocks of systems thinking: we can now identify a system's variables, distinguish between reinforcing and balancing feedback loops, and understand the crucial, often destabilizing, role of delays.
Today, we move from theory to practice. Our goal is to synthesize everything we've learned and master the hands-on skill of drawing a causal loop diagram (CLD) from a written product scenario. This is the core technique you will use as an architect to map, communicate, and analyze the complex systems behind the products you design. For a UI/UX professional bridging into architecture, this is the visual language that makes invisible system structures tangible and debatable.
1. The Anatomy of a Causal Loop Diagram
Before we start drawing, let's quickly formalize the components. A CLD has three key elements:
- Variables: Nouns or noun phrases representing factors that can change (e.g., Customer Satisfaction, Server Load).
- Causal Links: Arrows connecting variables, showing the direction of influence. Each link has a polarity:
- A (+) or (s) sign for "same direction": If the first variable increases, the second increases. If the first decreases, the second decreases.
- A (-) or (o) sign for "opposite direction": If the first variable increases, the second decreases, and vice-versa.
- Loop Identifiers: A label in the center of a loop indicating its type: 'R' for a reinforcing loop or 'B' for a balancing loop.
Delays are marked with a hash mark or double line across a causal link.
Systems Thinking: Causal Loop Diagrams
For a quick visual refresher on these components, this video by Dr. Donna Gurule provides a clear and concise overview.
Watch the first three minutes (00:00 - 03:09). This will quickly re-introduce the core components: variables, links, polarities, and the start of feedback loops.
2. A Step-by-Step Method for Drawing CLDs
Drawing a CLD isn't an artistic exercise; it's a structured process of inquiry. We can break it down into four clear steps.
Causal Loop Diagram: How to Visualize and Analyze System Dynamics
The article 'Causal Loop Diagram: How to Visualize and Analyze System Dynamics' provides an excellent, straightforward guide on this process. We'll use its structure for our method.
Please read the section titled 'How to Create a Causal Loop Diagram'. It outlines a four-step process that we will follow.
As the article outlines, our process is:
- Define the System and Key Variables: What problem are we exploring? What are the key moving parts?
- Map Relationships Between Variables: Draw arrows and assign polarities (+/-).
- Identify Feedback Loops: Trace the paths to find cycles and label them 'R' or 'B'.
- Test and Validate: Review the diagram. Does it tell a coherent story?
3. Walkthrough: Modeling a SaaS Subscription Product
Let's apply this method to a scenario relevant to your interests in SaaS products.
Scenario:
*A new productivity SaaS app gains initial traction. Happy Users spread the word, driving Word-of-Mouth Signups. As the Number of Users grows, the Server Load increases, which slows down App Performance. Poor performance lowers User Satisfaction. Dissatisfied users are less likely to recommend the app and more likely to leave, increasing the Churn Rate. The company can increase its Server Capacity to improve performance, but provisioning new servers takes time.
Step 1: Identify Key Variables
From the text, we can pull out the following nouns:
Number of UsersWord-of-Mouth SignupsServer LoadApp PerformanceUser SatisfactionChurn RateServer Capacity
A key best practice is to name variables so they can be measured or imagined as going up or down. "App Performance" is a good variable; "Improve App Performance" is not, as it describes an action, not a state.
Step 2: Map Relationships (Links & Polarity)
Now, we connect them link by link. For each connection, ask: "All else being equal, if variable A increases, what does variable B do?"
- An increase in
User Satisfactionleads to an increase inWord-of-Mouth Signups. (+) - An increase in
Word-of-Mouth Signupsadds to theNumber of Users. (+) - An increase in
Number of Usersincreases theServer Load. (+) - An increase in
Server LoaddecreasesApp Performance. (-) - An increase in
App PerformanceincreasesUser Satisfaction. (+) - An increase in
User Satisfactiondecreases theChurn Rate. (-) - An increase in
Churn Ratedecreases theNumber of Users. (-) - An increase in
Server CapacityincreasesApp Performance. (+)
Step 3: Identify Feedback Loops
Now we trace the arrows to find closed loops and determine their type.
System Dynamics: Systems Thinking and Modeling for a Complex World
This clip from an MIT OpenCourseWare lecture is excellent for seeing this step in action. The presenter builds a loop piece by piece and then explains how to identify its type.
Watch from 29:16 to 36:40. Pay attention to how the presenter walks through the 'employee skill' loop and identifies it as reinforcing. He also gives a handy shortcut: count the negative links. An even number (or zero) means it's a reinforcing loop. An odd number means it's a balancing loop.
Let's apply this to our SaaS scenario:
-
The Growth Engine (Reinforcing Loop):
Number of Users→ (+)Server Load→ (-)App Performance→ (+)User Satisfaction→ (+)Word-of-Mouth Signups→ (adds to)Number of Users.- Wait, that's complex. Let's simplify. The core growth loop is:
Number of Usersleads to moreWord-of-Mouth Signups, which in turn increases theNumber of Users. This is a classic reinforcing loop. Let's call it R1: Viral Growth.
-
The Performance Constraint (Balancing Loop):
Number of Users→ (+)Server Load→ (-)App Performance→ (+)User Satisfaction→ (-)Churn Rate→ (-)Number of Users.- Let's trace the effect of an increase: More users → higher load → worse performance → lower satisfaction → higher churn → fewer users. The loop pushes back against the initial increase.
- Count the negative links: There are three (
-,-,-). An odd number. This is a balancing loop. Let's call it B1: Performance Churn.
-
The Fix (Balancing Loop with Delay):
App Performancegoes down. This creates a gap between desired and actual performance. The company reacts by increasingServer Capacity.Server Capacity→ (+)App Performance. This closes the gap.- This is a balancing loop that seeks to correct the performance problem. But the scenario says provisioning servers "takes time." So, we must add a delay to the link between the decision to act and the effect on
Server CapacityorApp Performance. - Let's call this B2: Capacity Adjustment.
Our resulting diagram might look something like this:
A causal loop diagram for a SaaS product. Reinforcing loop R1 drives growth through word-of-mouth. Balancing loop B1 slows growth as server load impacts performance and increases churn. Balancing loop B2 represents the delayed effort to add server capacity to fix performance issues.
4. Practical Application: Your Turn
Now it's time for you to practice. This is the most critical part of the lesson.
Scenario: An Online Marketplace
An online marketplace for handmade goods (like Etsy) is launched. As more Sellers join, the Product Variety on the platform increases. This attracts more Buyers. A growing number of Buyers in turn attracts even more Sellers, creating a strong growth dynamic. However, as the number of Sellers grows, so does Competition among Sellers, which can lower their individual Profitability. Low profitability may cause some unhappy Sellers to Leave the platform. There's also a risk: a rapid influx of new sellers can reduce the overall Platform Quality if not managed. Lower quality erodes Buyer Trust, making them less likely to purchase and reducing sales for everyone.
Your Task:
On a piece of paper or using a simple drawing tool, try to draw the CLD for this marketplace scenario.
- Identify the variables (I've bolded them to help you start).
- Draw the causal links and add their polarities (+/-).
- Identify and label the feedback loops (aim for at least one 'R' loop and two 'B' loops). Don't forget to give them descriptive names (e.g., "Marketplace Growth", "Seller Competition", "Quality Erosion").
Take about 15 minutes to sketch this out. The goal is to make your thinking visible, not to create a perfect, polished diagram.
Click here to see my version of the diagram and compare.
A causal loop diagram for an online marketplace. R1: Network Effect is the primary growth engine. B1: Seller Saturation is a balancing loop where competition reduces profitability and causes sellers to leave. B2: Quality Erosion is another balancing loop where declining quality erodes buyer trust, ultimately reducing the incentive for sellers to join.
How did your diagram compare? It's okay if it's not identical! The most important thing is that the story your diagram tells is logical and consistent with the scenario. Naming the loops helps tell that story. For example, "R1: Network Effect" immediately communicates the core growth driver of a marketplace.
5. From Simple Diagrams to System Architecture
These diagrams are not just academic exercises. They are blueprints of a business's operating logic. As an architect, you would use them to identify both opportunities (how to strengthen 'R' loops) and risks (how to mitigate runaway 'R' loops or stressful 'B' loops).
For example, look at the classic CLDs for businesses like Uber and Etsy.
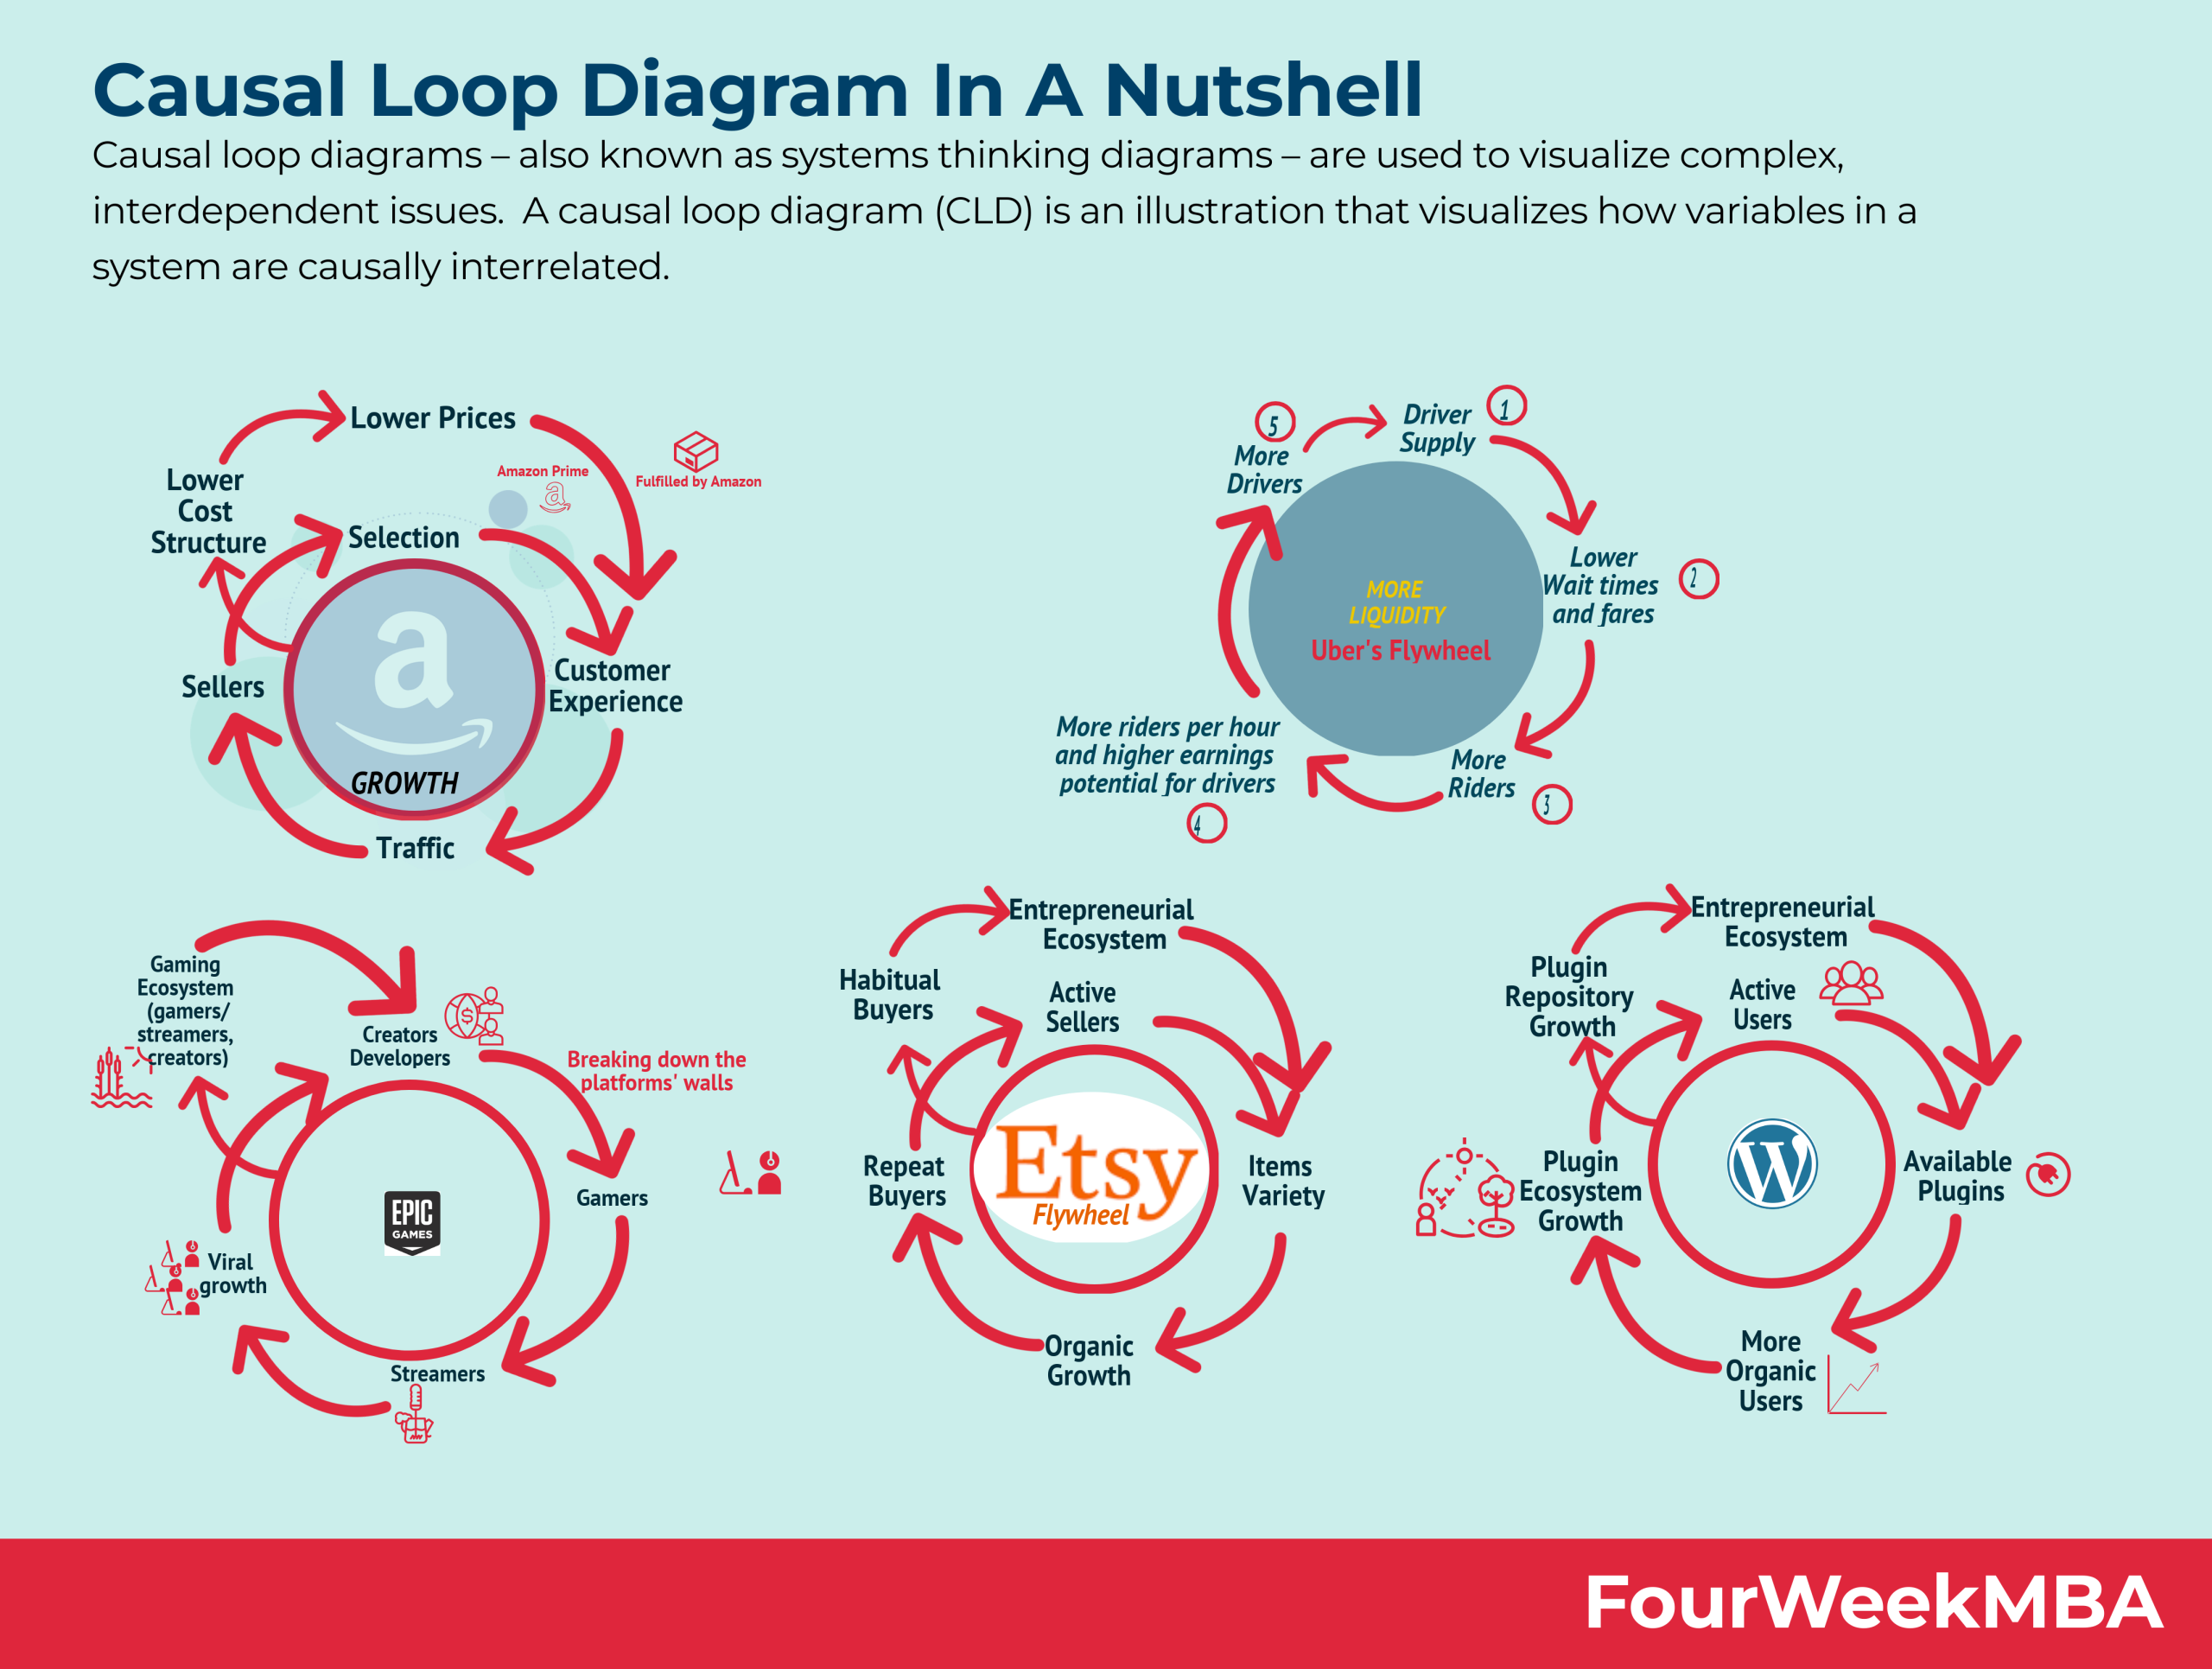
The Umbrex article you'll see next provides a fantastic, real-world example of how these diagrams are used in a strategic context for a B2B SaaS company.
System Dynamics Feedback-Loop Models
This resource provides a detailed example of applying CLDs to a B2B SaaS company facing slowing growth. It shows how mapping the system reveals multiple interacting loops driving the problem.
Please read section 6, 'Example: System Dynamics in a B2B SaaS Growth Engine'. Focus on the 'CLD highlights' and see if you can trace the four loops described in the text.
This example demonstrates the power of this tool. It moves beyond a single growth loop to show how capacity constraints, talent pipelines, and even technical debt all interact as feedback loops that determine the company's fate.
Conclusion
You now have the primary tool for modeling the dynamics of a product system. By translating written descriptions and mental models into explicit Causal Loop Diagrams, you can facilitate clearer conversations, identify leverage points for intervention, and anticipate unintended consequences.
Key Takeaways:
- Drawing a CLD is a structured 4-step process: identify variables, map links, find loops, and validate.
- Always ask "if A increases, what does B do?" to determine polarity. Use the odd/even rule for negative links to quickly identify loop types.
- Naming your loops (e.g., "R1: Viral Growth," "B1: Capacity Constraint") is crucial for telling a clear story about the system's behavior.
- CLDs make the invisible structures driving a product's success or failure visible to the entire team.
Next Lesson Preview:
Now that you can wield this powerful mapping tool, we will apply it to a specific and highly relevant system you're interested in: an AI recommendation engine. We'll deconstruct how services like Netflix or Spotify create feedback loops to personalize content and explore the unintended consequences that can arise from optimizing these powerful systems.