Hello! Welcome back to our module on Active Trading Strategies.
In our last lesson, we drew a clear line between day trading and swing trading, focusing on how the time horizon—from minutes to weeks—shapes every aspect of a trader's approach. You learned that while both are forms of active trading, they demand different strategies, risk management, and psychological skills.
Now, we'll address a fundamental question: How do you find stocks to trade in the first place? Out of the thousands of stocks available, only a small fraction are suitable for active trading on any given day. Your goal for this lesson is to identify characteristics of stocks suitable for active trading, such as high volume and volatility.
Mastering this will allow you to filter out the "noise" and focus your attention on stocks that actually offer trading opportunities.
1. The Two Pillars of a Tradable Stock
For an active trader, a stock isn't just a piece of a company; it's a vehicle for potential profit. To be a good vehicle, it needs two fundamental things: fuel and movement. In the stock market, these translate to liquidity and volatility.
Let's start with a foundational understanding of these two concepts.
12 Rules for Picking Stocks in Intraday Trading
The article '12 Rules for Picking Stocks in Intraday Trading' from Investopedia clearly states that successful day trading depends on selecting stocks with the right blend of characteristics. We'll use it to establish our core principles.
Read the sections 'Rule No. 1: Understand the Basics of Intraday Trading' and 'Rule No. 3: Follow Core Stock Selection Criteria'. Focus on the three critical factors mentioned: volatility, liquidity, and market attention. These are the foundations we will build on.
As the article highlights, finding the right stocks isn't about getting "hot tips." It’s a systematic process of identifying stocks with specific, measurable traits. Let's dig deeper into the two most important ones.
2. Liquidity: The Ability to Trade with Ease
Liquidity is arguably the most important characteristic. It means there are enough buyers and sellers for you to enter and exit a trade quickly, at a fair price, without your own order significantly moving the stock's price. An illiquid stock is like trying to sell a rare collectible; you might have to wait a long time to find a buyer and accept a lower price.
The primary measure of liquidity is trading volume.
Key Metrics for Liquidity:
-
Average Daily Volume: This tells you how many shares, on average, are traded each day. Active traders look for stocks with high average volume, often over 1 million shares, to ensure there's consistent interest.
-
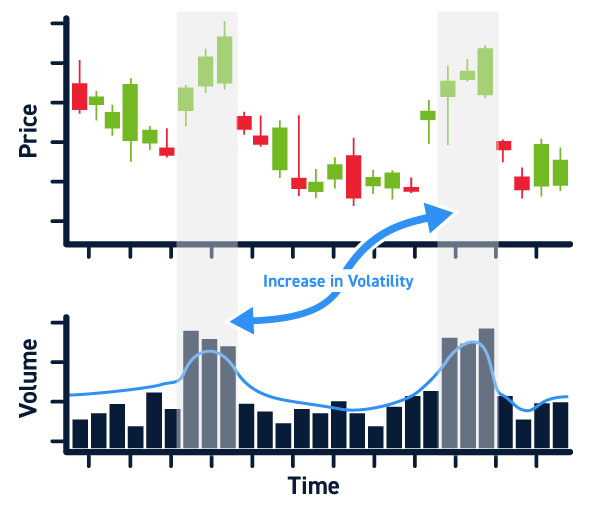
Relative Volume (RVOL): This is even more critical for day traders. Relative volume compares the current trading volume to the average volume. A stock with high RVOL is trading much more actively than usual, signaling that something is happening—news, an earnings report, or a surge in investor interest. This is what traders mean when they say a stock is "in play."
This image clearly shows the difference between normal and high relative volume.

High volume often precedes significant price moves, as it reflects the conviction of buyers and sellers.
3. Volatility: The Engine of Profit
While long-term investors often view volatility as risk, for an active trader, volatility is opportunity. If a stock's price doesn't move, you can't make money from it. Volatility is simply the measure of how much a stock's price fluctuates.
You want a stock that moves enough to offer profit potential but isn't so erratic that it becomes completely unpredictable.
Key Metrics for Volatility:
-
Average True Range (ATR): This indicator measures the average "true range" of price movement over a specific period (typically 14 days). A stock with an ATR of $2.50, for example, moves about $2.50 between its high and low on an average day. A higher ATR means more potential price movement to capture within a day or over a few days.
-
Beta: This metric measures a stock's volatility in relation to the overall market (usually the S&P 500).
- A Beta of 1 means the stock moves in line with the market.
- A Beta > 1 means the stock is more volatile than the market.
- A Beta < 1 means the stock is less volatile than the market.
Active traders often look for stocks with a Beta greater than 1, as these tend to have larger price swings.
To see how these concepts are applied in practice, let's watch a video that demonstrates how to screen for stocks using these exact criteria.
How To Find Stocks To Day Trade (Finviz & Tradingview Stock Screener Strategy)
The video 'How To Find Stocks To Day Trade' from The Secret Mindset channel provides an excellent, practical demonstration of how to use these characteristics as filters in a stock screener.
Watch the following segments to see how liquidity and volatility metrics are used: Introduction (00:00 - 00:53): The host introduces liquidity and volatility as the core concepts. Average Volume (00:53 - 01:24): Note the practical filter setting of 'Over 1 million' for liquidity. Relative Volume (02:08 - 03:14): Pay attention to why RVOL 'Over 1' is a key sign of increased interest. Beta (03:14 - 04:30): See how a Beta 'Over 1' filter helps find more volatile stocks. Average True Range (ATR) (05:31 - 06:25): Understand how ATR is used to find stocks with significant daily price swings.
4. Other Important Characteristics
Beyond liquidity and volatility, traders use a few other criteria to refine their search for the best trading candidates.
- Price: Many traders avoid extremely cheap "penny stocks" (often under $5) because they can be easily manipulated and lack interest from large institutional investors. They also might avoid very expensive stocks (e.g., $1000+) as they require more capital to trade.
- Market Capitalization: This can influence a stock's behavior. Large-cap stocks (e.g., >$10 billion) are often more stable and liquid, while small-cap stocks (<$2 billion) can be more volatile and offer explosive moves. Some traders specialize in one or the other.
- Float: This is the number of shares available for public trading. Stocks with a low float can be very volatile because a small amount of buying or selling pressure can cause a large price move.
- Catalyst: High volume and volatility rarely happen in a vacuum. They are often driven by a catalyst—a news event like an earnings report, a new product announcement, or an FDA approval. Identifying stocks with a recent catalyst is a core part of finding stocks that are "in play."
Test your understanding!
You are looking for a stock to day trade. You find two candidates:
-
Stock A (a large utility company):
- Average Volume: 5 million shares/day
- Relative Volume (today): 0.8
- ATR: $0.50
- Beta: 0.4
-
Stock B (a tech company that just reported surprising earnings):
- Average Volume: 3 million shares/day
- Relative Volume (today): 7.5
- ATR: $4.20
- Beta: 1.8
Which stock is a better candidate for active trading today, and why?
Show answer
Stock B is the far better candidate. Here's why:
- High Relative Volume: Its RVOL of 7.5 means it's trading at 7.5 times its usual volume. This indicates massive, unusual interest due to the earnings catalyst. Stock A's RVOL of 0.8 shows it's having a quieter-than-average day.
- High Volatility (ATR & Beta): Stock B's ATR of $4.20 means it has a large average daily range, offering significant profit potential. Its Beta of 1.8 confirms it is much more volatile than the market. Stock A has a very low ATR and Beta, meaning its price doesn't move much.
- Liquidity: While Stock A has a higher average volume, Stock B's average of 3 million is still highly liquid and sufficient for trading. The extreme relative volume today is the most important factor.
Conclusion
You've now learned the essential ingredients that make a stock suitable for the fast-paced world of active trading. Instead of randomly picking from thousands of options, you can now apply a systematic filter to find stocks that have the potential for movement.
Key Takeaways:
- Not all stocks are suitable for active trading. The best candidates are "in play."
- The two pillars of a tradable stock are Liquidity and Volatility.
- Liquidity, measured by trading volume, ensures you can enter and exit trades easily. Relative Volume (RVOL) is key for spotting unusual interest.
- Volatility, measured by ATR and Beta, provides the price movement necessary to generate profits.
- Other factors like price, market cap, and the presence of a catalyst help you further refine your watchlist.
A Look Ahead:
Finding a stock with these characteristics is the first step. The next is knowing when to trade it. In our next lesson, we will recognize the most active trading times of the day (e.g., market open and close), because even the best stock can be untradable during quiet periods.