Hello! Welcome to your next lesson on technical analysis.
In our last lesson, we dove into the Relative Strength Index (RSI) and saw how it helps measure the speed of price changes to identify potentially overbought or oversold conditions. We emphasized that a stock can stay overbought or oversold for long periods, and a stronger signal often comes when the RSI exits these zones.
Today, we'll add another essential momentum indicator to your toolkit: the Moving Average Convergence Divergence (MACD). While RSI is great for gauging overbought/oversold levels, the MACD is specifically designed to reveal changes in the strength, direction, and momentum of a trend. Your goal for this lesson is to learn how to apply the MACD indicator to identify changes in momentum. Mastering this will give you a powerful tool for confirming trends and timing your trades.
1. Deconstructing the MACD
The name "Moving Average Convergence Divergence" sounds complex, but the concept is straightforward. The indicator measures the relationship between two different Exponential Moving Averages (EMAs). It shows when these averages are moving together (converging) or moving apart (diverging).
The MACD indicator is typically displayed in a panel below the main price chart and has three key components.
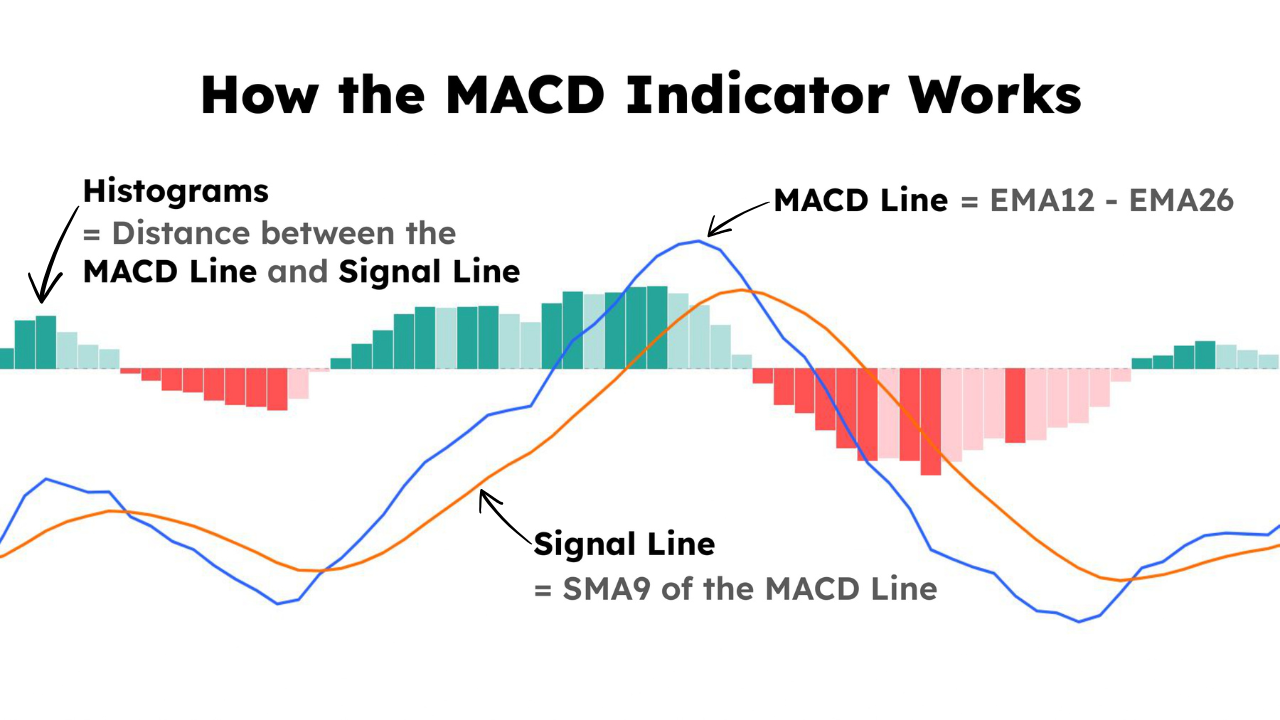
To get a clear, step-by-step introduction to these parts, let's watch a video from Charles Schwab.
This video, 'Trading Stocks with the MACD,' provides an excellent breakdown of each component of the indicator and how they are calculated and interpreted.
Watch from 00:22 to 04:50. The video is broken into three parts, each explaining one component. Pay close attention to: The MACD Line (00:22 - 02:11): How it represents the distance between the 12-period and 26-period EMAs. The Signal Line (02:11 - 03:13): How it acts as a slower 'trigger' line. The Histogram (03:13 - 04:50): How it visually represents the difference between the first two lines.
Let's summarize the key ideas from the video:
-
The MACD Line: This is the core of the indicator. It's calculated by subtracting the 26-period EMA from the 12-period EMA.
Because the 12-period EMA is faster and reacts more quickly to price changes, the MACD line shows the short-term momentum relative to the longer-term trend. -
The Signal Line: This is a 9-period EMA of the MACD line itself. It's a smoothed-out version of the MACD line, so it moves more slowly. Its purpose is to generate trading signals.
-
The MACD Histogram: This is a bar chart that illustrates the difference between the MACD line and the Signal line.
When the MACD line is above the Signal line, the histogram is positive (above zero). When the MACD line is below, the histogram is negative. The height of the bars shows how strong the momentum is.
2. The Three Primary MACD Signals
Now that you know the components, you can learn to interpret the signals they generate. There are three main ways to use the MACD to identify changes in momentum.
MACD (Moving Average Convergence/Divergence) Oscillator
The article 'MACD Oscillator' from ChartSchool is a fantastic resource that provides detailed explanations and chart examples for the most common MACD signals.
Please read the sections titled 'Signal Line Crossovers' and 'Centerline Crossovers'. Focus on understanding what each type of crossover signifies about the relationship between the moving averages and the overall trend momentum.
Based on that reading and the video, we can summarize the three main signals:
-
Signal Line Crossover: This is the most common signal.
- Bullish Crossover: When the MACD line crosses above the signal line, it suggests that momentum is shifting to the upside. This is often interpreted as a potential buy signal.
- Bearish Crossover: When the MACD line crosses below the signal line, it suggests that momentum is shifting to the downside. This is often interpreted as a potential sell signal.
-
Centerline (or Zero Line) Crossover: This signal indicates a broader change in the trend.
- Bullish Crossover: When the MACD line crosses above the zero line, it means the 12-period EMA has crossed above the 26-period EMA. This confirms that short-term momentum is stronger than long-term momentum, indicating an uptrend.
- Bearish Crossover: When the MACD line crosses below the zero line, it confirms a downtrend is in place.
-
Divergence: This is a more advanced signal that can warn of a potential trend reversal.
- Bullish Divergence: The stock price makes a new low, but the MACD line makes a higher low. This shows that downside momentum is weakening, and the trend might reverse to the upside.
- Bearish Divergence: The stock price makes a new high, but the MACD line makes a lower high. This shows that upside momentum is fading, and the trend might reverse to the downside.
This "cheat sheet" provides a great visual summary of these signals.

Test your understanding!
You are looking at a stock chart. The MACD line is currently at -0.50, and the signal line is at -0.40. In the next trading session, the MACD line moves to -0.35 while the signal line moves to -0.38.
- What type of signal has just occurred? Is it bullish or bearish?
- What does this signal suggest about the stock's momentum?
- What would need to happen for a stronger, trend-confirming bullish signal to occur?
Show answer
- A bullish signal line crossover has occurred. The MACD line (-0.35) has crossed above the signal line (-0.38).
- This suggests that the recent downside momentum is fading and that short-term momentum is starting to turn positive. It could be an early sign of a potential move up.
- For a stronger bullish signal, the MACD line would need to cross above the zero line (a centerline crossover). This would confirm that the overall trend has shifted from bearish to bullish.
3. Practical Application and Important Considerations
As with any indicator, there are important practical details to keep in mind.
Sticking to Standard Settings
When you add MACD to your chart, it will come with default settings, typically (12, 26, 9). For a practical reason, it's usually best to stick with these.
How I Nailed Trading with the MACD Indicator (Step-by-Step Guide)
It can be tempting to adjust indicator settings to find 'better' signals. However, as trader Ross Cameron explains in this clip, there's a strong case for using the same standard settings as most other market participants.
Watch from 05:41 to 08:48. Focus on the 'traffic light' analogy and the core reason for using standard settings: you want to see the same signals that are influencing the decisions of a large number of other traders.
MACD is a Lagging Indicator
Like all indicators based on moving averages, the MACD is lagging. It is based on historical price data, so its signals will always come after a price move has already started. This can lead to "whipsaws"—getting a buy signal right before the price turns back down, or a sell signal just before it rallies. Because of this, you should never rely on MACD alone. It is a confirmation tool, not a crystal ball.
Using MACD in Practice
Let's see how a trader might apply these signals to make decisions.
How I Nailed Trading with the MACD Indicator (Step-by-Step Guide)
In this final clip, the same trader demonstrates how to use MACD crossovers to find potential entry points and, just as importantly, to know when to stay out of the market.
Watch from 10:02 to 13:30. Notice how the trader focuses on taking trades only when the MACD is 'open' and in the direction of the trade (e.g., a bullish crossover for a buy). He avoids trading when the MACD is tangled or giving a bearish signal.
Conclusion
You have now learned how to use the MACD, one of the most popular and versatile technical indicators. By understanding its components and the signals they generate, you can better identify changes in trend direction and momentum. This gives you another powerful layer of evidence to support your trading decisions.
Key Takeaways:
- The MACD is a trend-following momentum indicator made up of the MACD line, a signal line, and a histogram.
- Signal Line Crossovers are timely signals that suggest a potential shift in momentum and can be used to pinpoint entries or exits.
- Centerline Crossovers are slower signals that help confirm the direction of the overall market trend.
- The Histogram provides a quick visual guide to the strength of momentum and can help you anticipate crossovers before they happen.
- Like all indicators, MACD is not foolproof. It can produce false signals and should always be used for confirmation alongside other analysis tools.
A Look Ahead:
In our next lesson, we will begin to tie these concepts together. You've learned about moving averages, the RSI, and now the MACD. We'll explore how you can use a combination of these indicators to build a more robust and reliable trading thesis, helping you avoid false signals and trade with greater confidence.