Hello! Welcome back to our journey into technical analysis.
In our last lesson, we contrasted the Simple Moving Average (SMA) and the Exponential Moving Average (EMA). You learned that the EMA is more responsive to recent price changes, making it "faster," while the SMA is "smoother" and better at showing the long-term, established trend. We discussed the trade-off: the EMA's speed can help you catch trends early but also makes it prone to false signals, whereas the SMA's smoothness avoids these "whipsaws" at the cost of being a lagging indicator.
Today, we will combine these ideas to build a classic and widely used trading strategy. Instead of using just one moving average, we'll use two to generate specific signals for when a trend might be changing direction. Your goal for this lesson is to learn how to use moving average crossovers to identify potential changes in trend direction. This is a fundamental technique for both active traders and long-term investors looking for better entry and exit points.
1. What is a Moving Average Crossover?
The core idea behind a crossover strategy is simple. We plot two moving averages on a chart:
- A short-term moving average (e.g., a 20-day or 50-day MA) that reflects recent momentum.
- A long-term moving average (e.g., a 100-day or 200-day MA) that represents the established, underlying trend.
When the short-term MA crosses over or under the long-term MA, it suggests that the recent momentum is becoming strong enough to potentially alter the established trend. Think of the short-term MA as a small, nimble speedboat and the long-term MA as a large, slow-moving oil tanker. When the speedboat sharply changes direction and crosses the tanker's path, it's a signal that the tanker itself might eventually have to start turning.
This first video introduces the concept of using two moving averages to find these crossover points.
The ONLY Moving Average Trading Guide You'll EVER Need!
The video 'The ONLY Moving Average Trading Guide You'll EVER Need!' by Tom Crown provides a great visual introduction to how crossovers work.
Watch the segment from 04:23 to 05:26. The presenter explains how combining two moving averages with different time periods can help determine when a trend has changed and shows clear examples on a chart.
2. Bullish and Bearish Crossovers
As the video explained, these crossovers generate two primary types of signals, which have become so famous they have their own names, especially when using the 50-day and 200-day moving averages.
The Bullish Crossover: The "Golden Cross"
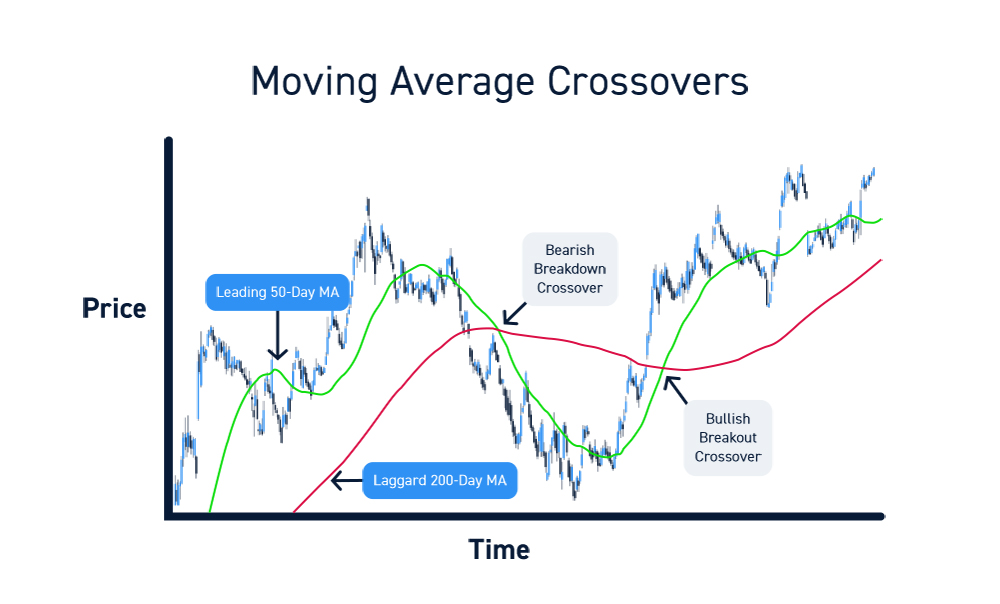
A Golden Cross occurs when the short-term moving average crosses above the long-term moving average. This is considered a bullish signal, suggesting that momentum is shifting to the upside and a new uptrend may be starting. Traders often interpret this as a potential buying opportunity.
The Bearish Crossover: The "Death Cross"
A Death Cross occurs when the short-term moving average crosses below the long-term moving average. This is a bearish signal, indicating that momentum is shifting to the downside and a new downtrend may be underway. This is often seen as a signal to sell or avoid buying.
The chart below clearly illustrates these two events.
To solidify your understanding of these terms, please read the following article.
Golden Cross vs. Death Cross: Differences and Strategies
The article 'Golden Cross vs. Death Cross' provides clear, concise definitions and step-by-step instructions for identifying these key patterns.
Read the sections 'Basics of Golden Cross vs. Death Cross' and 'How to Identify Golden Cross vs. Death Cross'. Focus on the definitions of each cross and the simple steps for spotting them on a chart.
3. A Critical Warning: The Lag and False Signals
While these signals are powerful, they are not foolproof. Since moving averages are based on past prices, they are lagging indicators. The crossover signal will always occur after the price has already started to change direction.
This lag creates a major risk, especially in markets that are not trending clearly but are instead moving sideways (a "ranging" or "choppy" market). In these conditions, the two moving averages can cross back and forth repeatedly, generating a series of false signals known as "whipsaws." Acting on every signal in such a market is a quick way to accumulate losses.
The next video gives an essential warning about this problem.
Golden Cross Explained: Why most traders get it wrong (and how it really works) | Forex Training
Trader Rayner Teo explains why blindly trading crossovers can be dangerous, especially in ranging markets. This is a crucial lesson in risk management.
Watch from 00:59 to 02:46. Pay close attention to his warning about getting 'whipsawed' and why you shouldn't just automatically buy or sell every time a crossover happens.
4. Using Crossovers More Effectively
So, if blindly trading crossovers is risky, how do you use them effectively? The key is to use them not as a standalone, absolute command, but as one piece of a larger puzzle. Here are two practical strategies.
Strategy 1: Use the Crossover as a "Trend Filter"
A smarter way to use crossovers is as a filter to guide your decisions.
- After a Golden Cross occurs on a daily chart, you now have a "green light" to look for buying opportunities. You wouldn't just buy blindly, but you would actively look for good entry points, like a price pullback to a support level.
- After a Death Cross, you have a "red light." You might decide to sell existing positions and stay in cash, or if you are an advanced trader, you would only look for short-selling opportunities.
This filtering approach keeps you trading in the direction of the dominant, newly established trend. The same video from Rayner Teo explains this concept perfectly.
Golden Cross Explained: Why most traders get it wrong (and how it really works) | Forex Training
Let's continue with Rayner Teo's video, where he explains how to use crossovers as a trend filter and combine different timeframes for better entries.
Watch from 02:46 to 06:30. Notice how he uses the Golden Cross on the daily chart to get permission to go long, and then zooms into a 4-hour chart to find a more precise entry point. This is a powerful, practical technique.
Strategy 2: Wait for Confirmation
A signal is always more reliable when it's confirmed by other evidence. Before acting on a crossover, look for other confirming signs.
Golden Cross vs. Death Cross: Differences and Strategies
The article we looked at earlier also has an excellent section on avoiding false signals. This provides a checklist of confirmation techniques.
Read the section 'How to Avoid False Signals in Golden Cross and Death Cross'. This section gives you a practical toolkit for confirming a signal, such as checking for high trading volume or using other indicators.
As the article mentions, a few key things to look for are:
- High Trading Volume: A crossover that occurs with a spike in trading volume is much more significant than one that occurs on low volume.
- Price Action: Does the price action support the signal? For a Golden Cross, you want to see the price break above a resistance level. For a Death Cross, you want to see it break below support.
- Other Indicators: Do other technical indicators confirm the signal? This is where your toolkit starts to come together.
Test your understanding!
You are looking at a daily chart of a stock and you see that the 50-day EMA has just crossed below the 200-day SMA.
- What is this signal called, and is it bullish or bearish?
- Based on the "trend filter" strategy, what should your general bias be for this stock now?
- What is one thing you would look for to confirm that this is a valid signal and not a whipsaw?
Show answer
- This signal is a Death Cross, and it is a bearish signal.
- Your general bias should be to avoid buying the stock. You would either sell any existing long positions or simply wait in cash. You would not be looking for buying opportunities until a new Golden Cross appears.
- To confirm the signal, you could look for: a significant increase in selling volume on the day of the cross, the price breaking below a key, long-term support level, or another indicator (like the RSI or MACD) also giving a bearish signal.
Conclusion
You've now learned how to use one of the most foundational strategies in technical analysis. By combining a short-term and long-term moving average, you can identify potential turning points in a trend. More importantly, you understand that this signal isn't a magic bullet, but a powerful tool that works best when used with caution and confirmation.
Key Takeaways:
- A Golden Cross (short-term MA crosses above long-term MA) is a bullish signal that a potential uptrend is beginning.
- A Death Cross (short-term MA crosses below long-term MA) is a bearish signal that a potential downtrend is beginning.
- Crossovers are lagging indicators and can produce false signals ("whipsaws") in sideways markets.
- Effective strategies involve using crossovers as a trend filter and always seeking confirmation from other sources like trading volume and price action.
A Look Ahead:
We've repeatedly mentioned the importance of confirming signals with other indicators. In the next lesson, we will add a new and powerful tool to your arsenal: the Relative Strength Index (RSI). You will learn how to calculate and interpret the RSI to identify "overbought" and "oversold" conditions, giving you another critical piece of evidence to improve your trading decisions.