Hello! Welcome back to your journey into data analytics.
In our last lesson, we explored the four main types of analytics—descriptive, diagnostic, predictive, and prescriptive. This framework helps you classify the kinds of questions you can answer with data, moving from understanding the past to shaping the future. Now that you know what you can achieve with analytics, it's time to learn how analysts systematically get there.
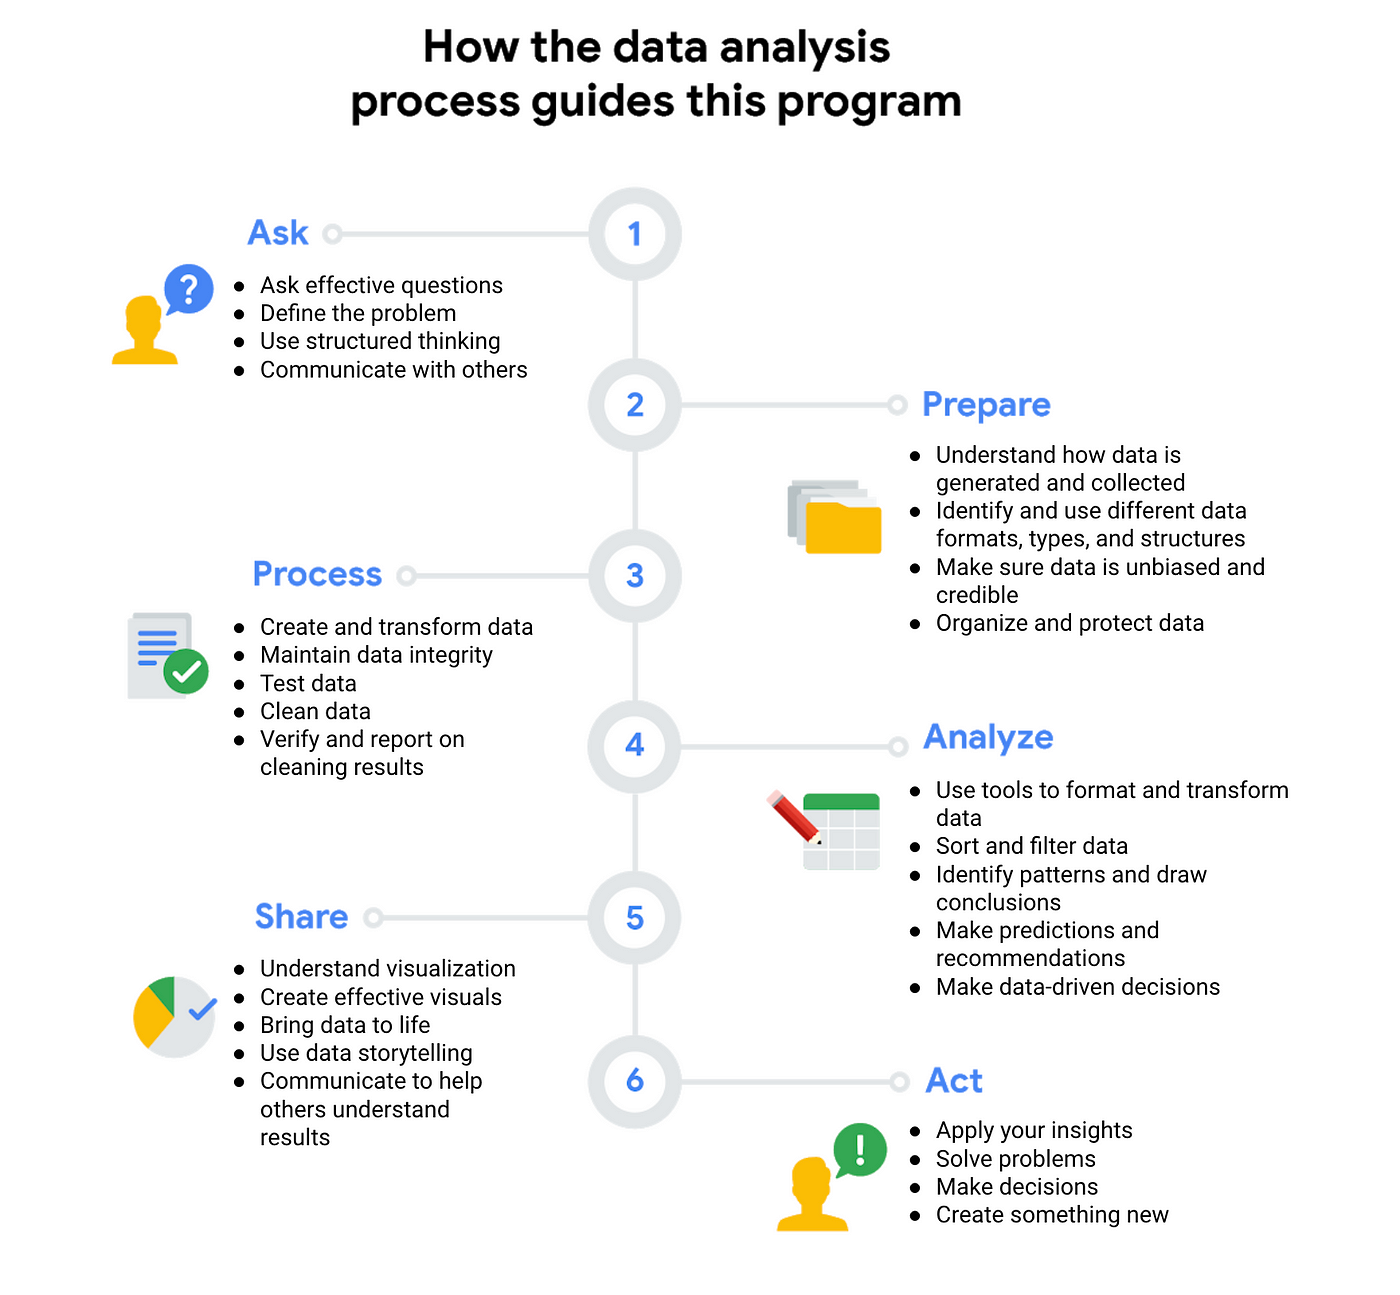
This lesson introduces the standard data analysis workflow, a six-step process that provides a reliable roadmap for any data project. By the end of our session, you will be able to identify and describe each stage of this workflow: Ask, Prepare, Process, Analyze, Share, and Act. Mastering this process is fundamental, as it provides the structure needed to transform raw data into meaningful, actionable insights.
The Data Analysis Workflow: A Bird's-Eye View
Think of the data analysis workflow as a recipe. Just as a chef follows specific steps in a certain order to create a dish, a data analyst follows a structured process to turn a business question into a solution. While presented as a linear sequence, this process is often iterative, meaning an analyst might revisit earlier steps as they learn more from the data.
This six-step framework is widely adopted in the industry, and it's the same one taught in Google's professional data analytics certification. The image below provides a great high-level overview of the entire process.
To start, let's watch a brief video from Google that introduces this entire process using a real-world example.
Breaking Down the Data Analysis Process | Google Data Analytics Certificate
This video from Google Career Certificates provides a concise and clear overview of the six steps of the data analysis process, explained by a professional in the field.
Watch the video in its entirety, from the beginning to the end. As you watch, notice how each step logically follows the previous one, building a complete project from start to finish.
Now, let's break down each of these six steps in more detail, using a running example relevant to a pharmacy setting.
Step 1: Ask
The entire process begins with a question. However, simply having a question is not enough. The Ask phase is about defining the problem precisely, understanding the goals of stakeholders (e.g., your managers, clinical staff), and formulating clear, answerable questions. A poorly defined problem at the start can lead to a useless analysis at the end.
Key activities in this phase include:
- Clarifying the business need (e.g., are we trying to save money, improve patient safety, or increase efficiency?).
- Defining the scope of the project.
- Identifying the key stakeholders and their expectations.
Intro to Data Analysis: The "Google Method" | Towards Data Science
This article from Towards Data Science breaks down the Google method. Let's start with its explanation of the 'Ask' phase.
Read the section titled 1. Ask. Notice the emphasis on understanding the business need and working with stakeholders to define the problem.
Pharmacy Example:
A hospital's chief pharmacist is concerned about medication adherence for patients recently discharged with chronic conditions. A vague request might be, "Find out about patient adherence." A skilled analyst in the Ask phase would refine this by asking clarifying questions:
- Which chronic conditions are we most concerned about (e.g., heart failure, diabetes)?
- How do we define "adherence"? Is it picking up the first prescription, or consistently refilling it for three months?
- What is the goal? Are we trying to identify high-risk patient groups to target with interventions?
The result is a focused question: "What is the 90-day prescription refill rate for patients over 65 discharged after a heart failure diagnosis, and what patient-level factors correlate with non-adherence?"
Step 2: Prepare
Once you have a clear question, you need data to answer it. The Prepare phase involves identifying the right data sources, gathering the data, and organizing it. This step is about laying the groundwork for your analysis.
Key activities include:
- Identifying what data is needed and where to find it.
- Understanding different data types, formats, and structures.
- Ensuring data is collected in a way that respects privacy and governance rules (a critical concern in healthcare).
Intro to Data Analysis: The "Google Method" | Towards Data Science
Now, let's look at the 'Prepare' phase in the same article.
Read the section titled 2. Prepare. This section highlights how the business need from the 'Ask' phase motivates the data needs in this phase.
Pharmacy Example:
To answer our adherence question, the analyst would need to prepare by sourcing data from several systems:
- Electronic Health Record (EHR): To get patient demographics (age), diagnosis codes (heart failure), and discharge dates.
- Pharmacy Dispensing System: To get prescription refill dates and medication names.
- Hospital Admission System: To confirm admission and discharge information.
The analyst would then need to integrate these separate datasets into a single file or database for analysis.
Step 3: Process
Raw data is almost never clean. It is often messy, incomplete, and full of errors. The Process phase, also known as data cleaning or data wrangling, involves cleaning and organizing the raw data to make it suitable for analysis. This is often the most time-consuming part of the entire workflow, but it is absolutely critical. Analyzing dirty data leads to flawed conclusions.
Key activities include:
- Correcting errors and typos.
- Handling missing values.
- Removing duplicate records.
- Transforming data into a more useful format.
This video provides a practical perspective on the processing phase, emphasizing how it makes the data more meaningful.
Watch the segment on the processing phase from this timestamp. The speaker correctly points out that this step involves manipulating the data to prepare it for analysis.
Pharmacy Example:
In our adherence project, the process phase might involve:
- Standardizing medication names: The dispensing system might list "Lisinopril 10mg," "Lisinopril," and "Lisinopril Tab 10MG." These need to be standardized to a single name.
- Handling missing refill data: What does it mean if a patient has no refill record? Does it mean they are non-adherent, or did they fill their prescription at a different pharmacy? This needs to be investigated and documented.
- Filtering for the correct cohort: Removing patients who are not over 65 or who were not diagnosed with heart failure.
Step 4: Analyze
With clean, processed data in hand, you can finally begin the Analyze phase. This is where you explore the data, look for patterns, identify relationships, and extract insights that answer the question from the "Ask" phase. This step involves using tools ranging from simple spreadsheets to complex statistical software and programming languages.
Key activities include:
- Sorting, filtering, and aggregating data.
- Using descriptive statistics to summarize the data.
- Creating visualizations to spot trends.
- Building predictive models, if applicable.
Intro to Data Analysis: The "Google Method" | Towards Data Science
The 'Analyse' section of the article explains that this is where you find the patterns and trends that solve the business problem.
Read the section titled 4. Analyse. It emphasizes that this is the stage where the value latent within the data is unlocked.
Pharmacy Example:
In the analyze phase, the analyst discovers that the 90-day refill rate is only 60%. By exploring the data further, they find a strong correlation: patients who live alone are significantly less likely to refill their prescriptions compared to those who live with family. They also find that patients discharged on a Friday have lower adherence rates than those discharged mid-week.
Step 5: Share
An insight is useless if it isn't communicated effectively. The Share phase is about presenting your findings to stakeholders in a way that is clear, concise, and compelling. This often involves data storytelling—crafting a narrative that explains what you found, why it matters, and what you recommend.
Key activities include:
- Creating effective visualizations (charts and graphs).
- Summarizing findings in reports or presentations.
- Tailoring the communication style to the audience (e.g., technical vs. non-technical).
The presenter in this video makes an excellent point about the importance of knowing your audience and being direct in your communication.
Watch his advice on the 'Share' phase from this timestamp.
Pharmacy Example:
The analyst doesn't just email a spreadsheet with numbers. To share their findings, they create a short presentation for the chief pharmacist and discharge planning team.
- A pie chart shows the overall 60% adherence rate.
- A bar chart compares the adherence rates of patients living alone versus with family.
- They tell a story: "Our analysis shows that two-fifths of our heart failure patients are at high risk of complications due to non-adherence. The data points to two key risk factors: living alone and being discharged right before a weekend."
Step 6: Act
The final and most important phase is to Act. Data analysis should lead to action. This phase involves stakeholders using the insights from the analysis to make data-driven decisions and implement changes. The analyst's role is to ensure their findings are understood and to help translate them into actionable recommendations.
Intro to Data Analysis: The "Google Method" | Towards Data Science
This final section explains that the goal of the entire process is to persuade decision-makers to act on your insights.
Read the section titled 6. Act. The author rightly states that without this step, the analysis has little impact.
Pharmacy Example:
Based on the analyst's presentation, the hospital decides to act. They launch a new pilot program where pharmacy technicians make follow-up calls specifically to heart failure patients discharged on Fridays or who are documented as living alone. They also partner with the discharge planning team to provide these patients with extra counseling and resources before they leave the hospital. The success of this new program will, of course, be measured with more data analysis, bringing the process full circle.
Conclusion
In this lesson, we have walked through the six-step data analysis workflow. This structured process—Ask, Prepare, Process, Analyze, Share, Act—is the backbone of any successful data analytics project. It provides a clear path from a vague business problem to a concrete, data-driven action.
Key Takeaways:
- The data analysis process is a structured, six-step workflow.
- Ask: Define the problem and ask clear, answerable questions.
- Prepare: Collect and organize the necessary data from various sources.
- Process: Clean and validate the data to ensure it is accurate and ready for analysis.
- Analyze: Explore the data to find patterns, trends, and insights.
- Share: Communicate your findings effectively through visualizations and storytelling.
- Act: Use the insights to make informed decisions and drive change.
Now that you have a map of the entire process, our next lessons will start to zoom in on the details. The "raw material" of this entire workflow is data, but not all data is the same. In our next lesson, we will explore the first fundamental distinction you must learn as an analyst: the difference between quantitative and qualitative data. This is a core concept that you'll use constantly, especially in the "Prepare" phase of your work.