Hello again, and welcome back to your introduction to data analytics.
In our last session, we mapped out the entire data analysis journey by exploring the six-step workflow: Ask, Prepare, Process, Analyze, Share, and Act. This process provides a reliable framework for any project. Now, we will focus on the fundamental "raw material" of this entire process: the data itself.
This lesson addresses a foundational concept you will use every day as an analyst. By the end, you will be able to differentiate between quantitative and qualitative data. Understanding this distinction is crucial because the type of data you have dictates the questions you can ask, the cleaning you must perform, and the analytical methods you can apply. As a pharmacy student, you've already encountered both types of data, perhaps without using these specific labels—from precise dosage measurements to patient descriptions of their symptoms. Today, we'll formalize that understanding.
The Two Fundamental Types of Data
At its core, all data can be divided into two main categories: quantitative and qualitative. The difference is straightforward:
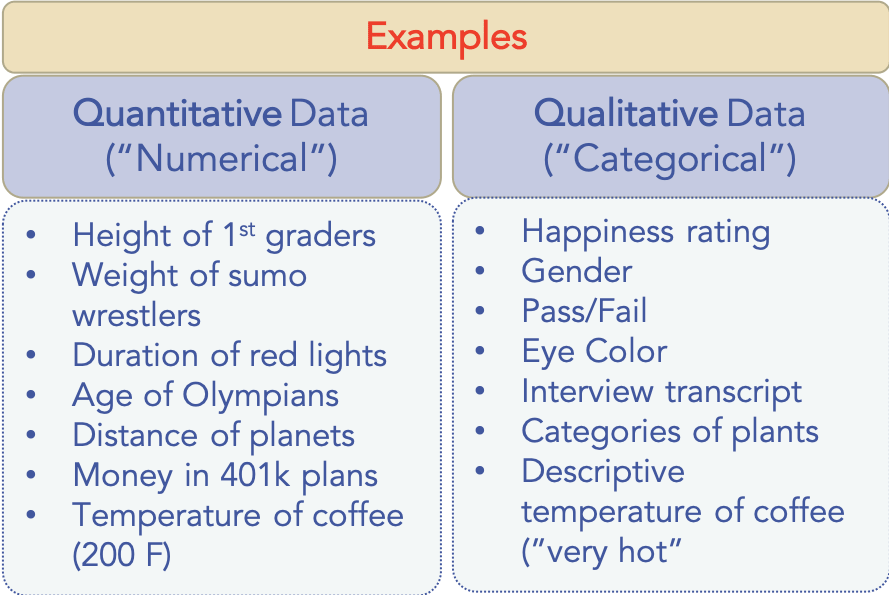
- Quantitative data deals with numbers and things you can measure objectively. It answers questions like "how much?" or "how many?".
- Qualitative data deals with descriptions and things you can observe but not measure directly. It answers questions like "what kind?" or "what are the reasons?".
This short video from The Organic Chemistry Tutor provides a very clear initial explanation of this distinction. It also introduces two important sub-types of quantitative data—discrete and continuous—which we will discuss next.
This video offers a concise and effective breakdown of the core differences between quantitative and qualitative data.
Watch from the beginning to the end. Pay close attention to: The fundamental difference between numbers (quantitative) and words (qualitative). The explanation of discrete vs. continuous quantitative data. The examples provided in the quiz at the end, which help solidify the concepts.
Quantitative Data: The World of Numbers
As you just saw, quantitative data is all about numerical values. Think of it as anything you can count or measure. Given your background in the sciences, you are already very familiar with this type of data.
Let's use a guide from the University of Maryland Health Sciences Library to get a formal definition in a healthcare context.
This guide provides a concise definition of quantitative data with relevant health-related examples.
Read the section under "Common Data Types" titled Quantitative Data.
As the resources explained, quantitative data can be further broken down into two categories:
-
Discrete Data: This data is countable and can only take on specific, whole-number values. You can't have half of a discrete data point.
- Pharmacy Examples: The number of tablets in a prescription (e.g., 30, 60, 90), the number of patients in a clinical trial, the number of refills a patient has received.
-
Continuous Data: This data is measurable and can take on any value within a given range. There are infinite possibilities between any two values.
- Pharmacy Examples: A patient's weight in kilograms (e.g., 70.5 kg), body temperature (e.g., 37.2°C), the concentration of a drug in a patient's bloodstream (e.g., 12.8 ng/mL), the time it takes for a medication to dissolve.
Qualitative Data: The World of Descriptions
Qualitative data, sometimes called categorical data, is non-numerical and descriptive. It provides context and helps us understand the 'why' behind the numbers. It's based on properties, characteristics, or observations.
Let's return to the University of Maryland guide for a definition.
This part of the guide defines qualitative data and provides excellent examples from a healthcare setting.
Read the section immediately following the previous one, titled Qualitative Data.
Examples of qualitative data are everywhere in pharmacy and healthcare:
- Patient Demographics: Gender (Male, Female, Other), blood type (A, B, AB, O).
- Medication Information: Drug name (e.g., "Lisinopril"), drug formulation (Tablet, Capsule, Syrup), manufacturer name.
- Patient-Reported Outcomes: Descriptions of side effects ("mild headache," "dizziness," "upset stomach"), patient satisfaction ratings ("Satisfied," "Neutral," "Dissatisfied").
The following images provide a clear visual summary of the distinction and offer more examples. The first one is specific to pharmaceuticals, and the second gives more general examples.

Why This Distinction is Crucial for Analysis
The reason we care so much about this difference is that quantitative and qualitative data are analyzed using entirely different methods.
- You can perform mathematical operations on quantitative data. You can calculate an average dose, find the maximum blood pressure reading, or plot a patient's weight change over time.
- You cannot perform mathematical operations on qualitative data. You can't calculate the "average" of "Tablet" and "Capsule." Instead, you analyze qualitative data by grouping, counting frequencies, and looking for themes. For example, you can count how many patients are male versus female or identify the most commonly reported side effect from a list of descriptions.
In healthcare, these two types of data work together to provide a complete picture. A short video from GCP-Mindset, a channel focused on clinical research, reinforces these definitions in a clinical context.
5 Minutes statistics for clinical research - Quantitative and Qualitative Data
This video quickly reviews the definitions of quantitative and qualitative variables from a clinical research perspective.
Watch the segment from this timestamp to hear how these data types are defined in a setting you're familiar with.
Imagine a clinical study for a new hypertension drug.
- Quantitative research would measure the change in systolic blood pressure in millimeters of mercury (e.g., "a mean reduction of 15 mmHg"). This gives you an objective, generalizable result.
- Qualitative research might involve interviewing patients about their experience. They might report feeling "less stressed" or finding the once-daily pill "easy to remember." This explains why the drug might be effective in the real world—it's not just about the numbers, but also about patient adherence and quality of life.
This combination of "what" (quantitative) and "why" (qualitative) is incredibly powerful. The following article on healthcare research explains this synergy well.
Quantitative and Qualitative Research in Healthcare
This article explores how both quantitative and qualitative approaches contribute to medical knowledge, highlighting their respective strengths and weaknesses.
Read the sections on Quantitative Research and Qualitative Research. Finally, read the short section on Integrating them, which brings the two concepts together.
A Final Note: Data Can Be Transformed
It's also useful to know that sometimes, an analyst will deliberately convert data from one type to another to enable a different kind of analysis. For example, you can convert quantitative data into qualitative categories.
The video from GCP-Mindset has a great segment explaining this.
5 Minutes statistics for clinical research - Quantitative and Qualitative Data
This final clip demonstrates how a single piece of data can be represented at different levels of detail.
Watch from this section, where the presenter explains how a quantitative measure like "sport activities per week" can be transformed into qualitative categories like "casual activities" or simply "yes/no".
This is a common technique. For instance, you might take a patient's exact age (quantitative) and categorize them into a group like "Pediatric," "Adult," or "Geriatric" (qualitative) to compare outcomes across different age groups.
Conclusion
In this lesson, we have established the fundamental difference between quantitative and qualitative data. This is a core concept that underpins much of what you will do in data analytics.
Key Takeaways:
- Quantitative data is numerical, representing quantities that can be counted (discrete) or measured (continuous). Examples include dosage, patient count, and temperature.
- Qualitative data is descriptive and non-numerical, representing qualities or categories. Examples include medication names, patient gender, and descriptions of side effects.
- The type of data you have determines the analytical methods you can use (e.g., mathematical calculations for quantitative, grouping and counting for qualitative).
- In fields like pharmacy and healthcare, both data types are often used together to gain a comprehensive understanding of a problem.
You now understand the nature of data. In our next lesson, we will build on this by exploring how data is organized. We will learn to differentiate between structured, semi-structured, and unstructured data formats. This will take us one step closer to understanding the data you'll encounter in real-world systems like databases and electronic health records.