Hello! Welcome to the first lesson in our new module on Tree-Based Models.
In the previous module, we focused on classification models like logistic regression and SVMs, which are powerful but can sometimes feel like a "black box." You learned how to evaluate them, handle class imbalance, and even tune them for specific business goals by selecting an optimal classification threshold.
Now, we're going to explore a completely different and highly intuitive family of models: Decision Trees. These models work in a way that is very similar to how humans make decisions—by asking a series of simple questions to arrive at a conclusion. They are highly interpretable, which aligns perfectly with your goal of being able to explain and justify your modeling choices.
Your learning outcome for this lesson is to build and interpret a decision tree for a classification or regression task. We will cover the fundamental structure of a tree, how it makes predictions, and how you can build and visualize one in Python.
Part 1: The Anatomy of a Decision Tree
At its core, a decision tree is a flowchart-like structure. You start at the top (the root) and follow a path down by answering a series of yes/no questions about your data features until you reach a final outcome at a leaf.
There are two main types of decision trees, which directly correspond to the two main types of supervised learning tasks you've seen:
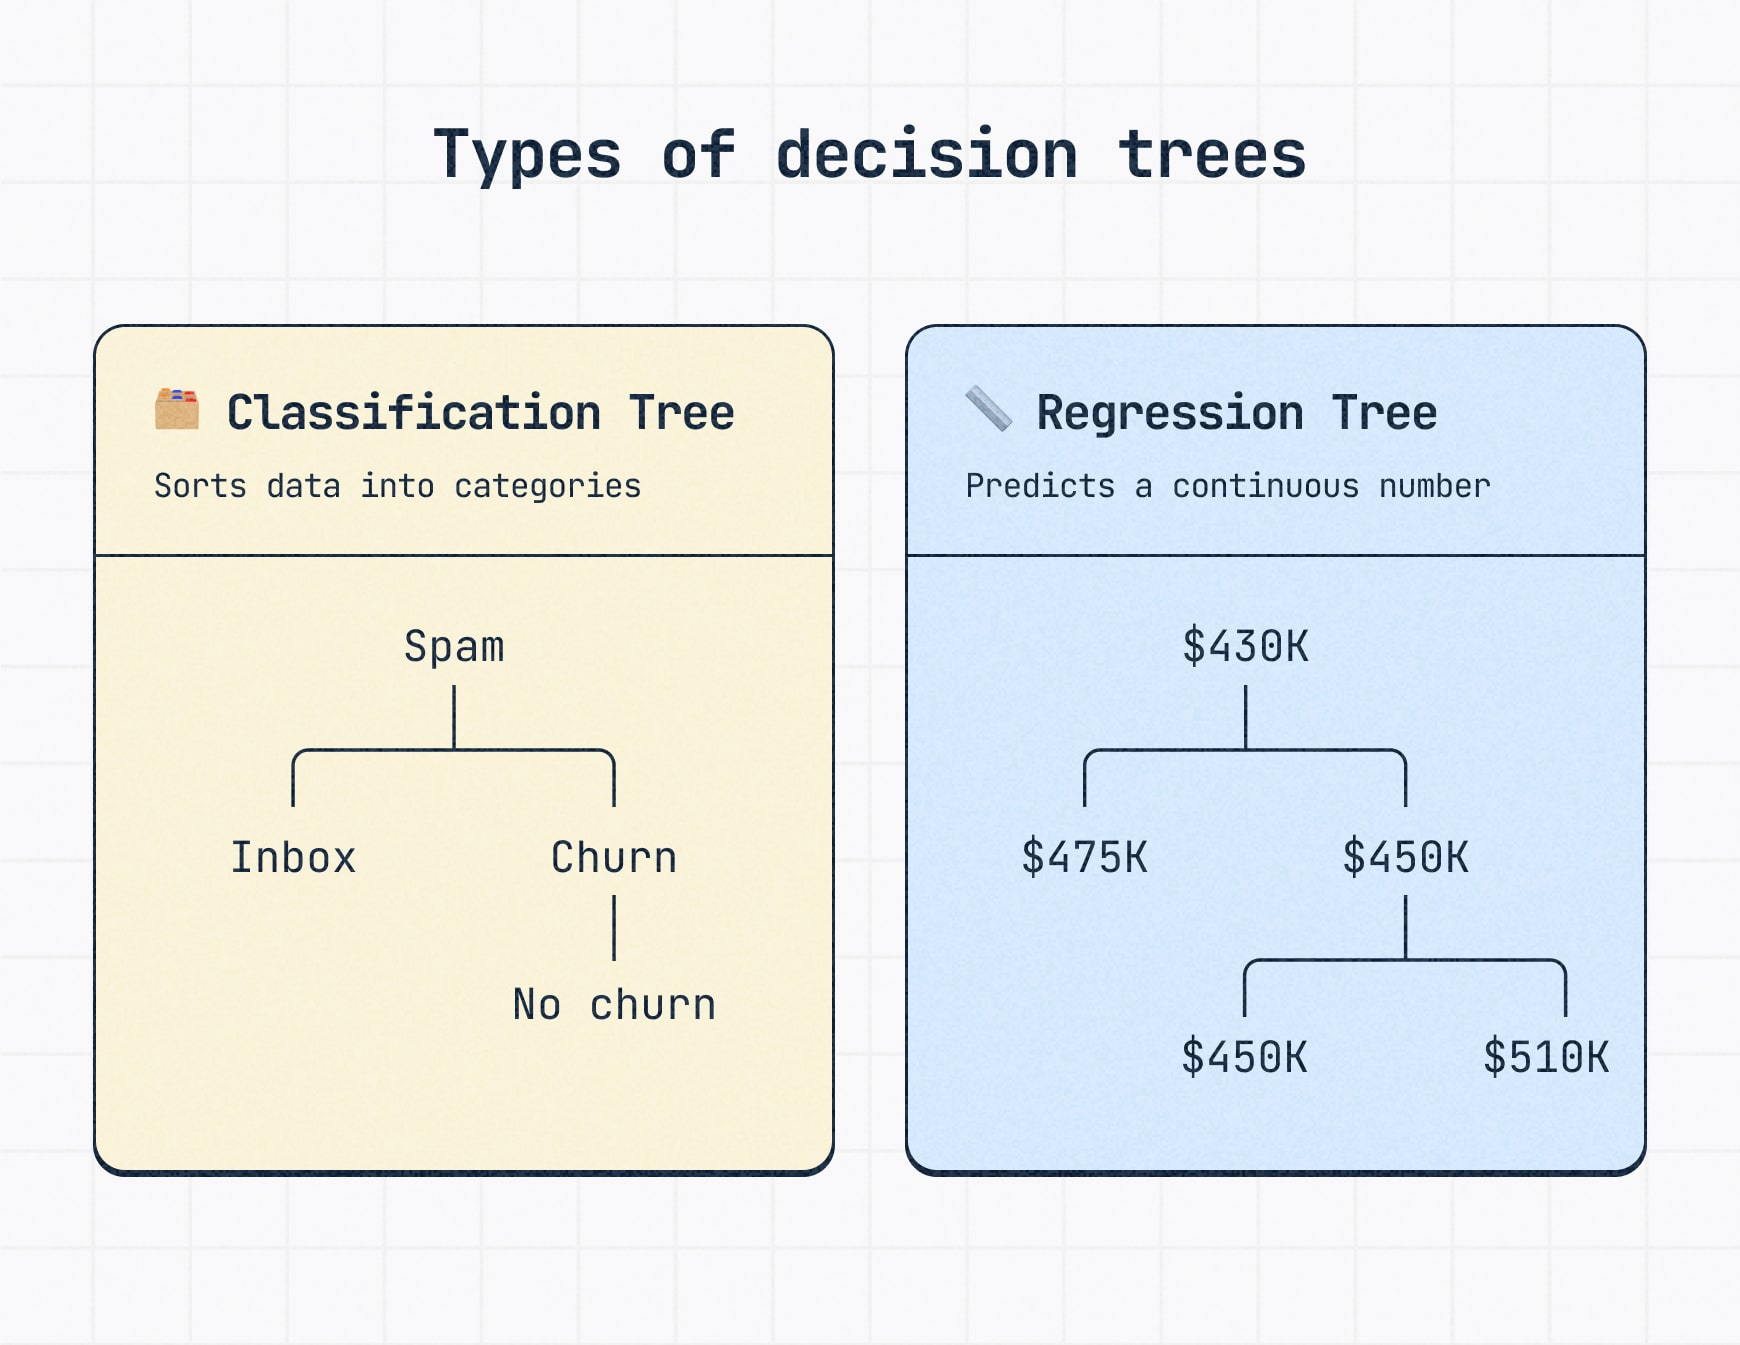
To get a feel for how these trees work in practice, let's start with a video that clearly explains the basic concepts and terminology.
Decision and Classification Trees, Clearly Explained!!!
This video from StatQuest with Josh Starmer provides an excellent introduction to decision trees. It explains how to interpret a tree and defines the essential terminology.
Watch the video from the beginning to 03:21. Focus on: The difference between classification and regression trees. How to follow the branches of a tree to classify a new data point. The definitions of the 'root node,' 'internal nodes,' and 'leaf nodes.'
As the video explained, every decision tree consists of:
- Root Node: The single top-most node, which represents the entire dataset and the first question you ask.
- Internal Nodes (or Branches): Nodes that represent a question or a "test" on a feature. They have arrows pointing to them and arrows pointing away from them.
- Leaf Nodes: The terminal nodes of the tree where the final prediction (a class label or a numeric value) is made. They have arrows pointing to them but none pointing away.
Interpreting a tree is as simple as starting at the root and traversing the path based on the answers to the questions at each node until you reach a leaf. Each path from the root to a leaf represents a specific decision rule.
Part 2: Building a Tree - The Core Idea
How does an algorithm decide which questions to ask, in what order, and what thresholds to use? The process of building a tree is conceptually straightforward and is often done using an algorithm called CART (Classification and Regression Trees).
The core idea is to perform a series of splits that make the resulting groups of data more "pure" or homogeneous.
- For a classification tree, a node is pure if it contains samples from only one class.
- For a regression tree, a node is "pure" (or homogeneous) if the samples it contains have very similar numerical values (i.e., low variance).
The algorithm takes a top-down, greedy approach. "Top-down" means it starts at the root with all the data and recursively splits it. "Greedy" means that at each step, it chooses the single best split possible at that moment to achieve the most significant immediate increase in purity, without looking ahead to see if a different split now might lead to an even better overall tree later.
Understanding Decision Trees: Algorithms, Splits, and ...
This article, 'Understanding Decision Trees', provides a good textual overview of the building process and the concept of homogeneity.
Read the section titled 'Splitting and Homogeneity'. Focus on the intuition that a good split is one that makes the resulting subsets as homogeneous as possible with respect to the target variable.
To decide which split is "best," we need a way to numerically measure the purity of a node. For classification, a common metric is the Gini Impurity.

For now, you only need to know that a lower Gini Impurity score is better. The algorithm calculates the Gini score for every possible split on every feature and chooses the split that results in the largest reduction in Gini impurity. We will dive into the exact formula for Gini impurity in our next lesson.
For regression trees, the logic is similar. Instead of maximizing purity, the goal is to find splits that minimize the error in the child nodes. A common metric for this is the Sum of Squared Residuals (SSR) or Mean Squared Error (MSE). The prediction made at a leaf is simply the average of the target values of all the training samples that end up in that leaf.
Regression Trees, Clearly Explained!!!
The following StatQuest video explains how regression trees are built. It introduces the idea of using the Sum of Squared Residuals (SSR) to find the best split.
Watch from 02:32 to 05:03 to see how a regression tree makes predictions, and then from 06:42 to 13:05 to understand the splitting process. Focus on the core idea: the algorithm searches for a split threshold that minimizes the SSR, which is a measure of prediction error.
Test your understanding!
Look again at the cancer diagnosis decision tree image above. Imagine you have a new patient with the following measurements:
worst radius= 15.0worst concave points= 0.08texture error= 0.5
Starting from the root, trace the path through the tree. What is the final predicted class for this patient?
Show answer
The predicted class is benign.
Path:
- Root: Is
worst radius <= 16.795? Yes (15.0 <= 16.795). Go left. - Node 2: Is
worst concave points <= 0.136? Yes (0.08 <= 0.136). Go left. - Node 3: Is
texture error <= 0.542? Yes (0.5 <= 0.542). Go left. - Leaf Node: You've reached a leaf node. The
valueis[330, 8], meaning 330 samples in this leaf are 'benign' and 8 are 'malignant'. The majority class is 'benign', so that is the prediction.
Part 3: Building a Decision Tree in Python
Now let's move from theory to practice. We will use the scikit-learn library, which provides easy-to-use implementations for both classification and regression trees.
The key classes are DecisionTreeClassifier and DecisionTreeRegressor. A crucial parameter for both is max_depth. This parameter limits how many "layers" of questions the tree can ask. It's one of the most common ways to control the complexity of the tree and prevent overfitting—a situation where the model learns the training data perfectly but fails to generalize to new, unseen data.
CART Decision Trees: Complete Guide to Classification and ...
The article 'CART Decision Trees: Complete Guide' provides a clean, practical demonstration of how to implement and visualize decision trees in Python using scikit-learn.
Read the section 'Implementation in Scikit-learn'. Focus on the code blocks under 'Classification Implementation' and 'Regression Implementation', and the final visualization code. Pay attention to how the models are instantiated with parameters like max_depth and min_samples_leaf to control complexity.
Let's walk through the key steps for building a classification tree from that resource:
-
Import and Instantiate: First, you import the class and create an instance of the model. You can set hyperparameters like
max_depthhere.from sklearn.tree import DecisionTreeClassifier # Instantiate the classifier with a maximum depth of 5 # and require at least 10 samples in a leaf node. clf = DecisionTreeClassifier(max_depth=5, min_samples_leaf=10, random_state=42) -
Fit the Model: Train the model on your training data.
# Assume X_train and y_train are your training features and labels clf.fit(X_train, y_train) -
Visualize the Tree: This is the most powerful step for interpretation. Scikit-learn's
plot_treefunction makes it easy.from sklearn.tree import plot_tree import matplotlib.pyplot as plt plt.figure(figsize=(20, 10)) plot_tree(clf, feature_names=X_train.columns, class_names=['Class_0', 'Class_1'], filled=True, rounded=True) plt.show()
The process for a regression tree is almost identical; you just use DecisionTreeRegressor instead and the criteria shown in the nodes will be based on MSE instead of Gini impurity.
Conclusion
In this lesson, you've learned the fundamentals of decision trees, one of the most interpretable and foundational models in machine learning. You can now explain what a tree is, how it works for both classification and regression, and how to build and interpret one yourself.
Key Takeaways:
- Decision trees make predictions by asking a series of if-then-else questions on features.
- Classification trees predict a class label at the leaf nodes, while regression trees predict a continuous value (typically the average of the samples in that leaf).
- Trees are built using a greedy, top-down approach, where each split is chosen to maximize the homogeneity (or "purity") of the resulting child nodes.
- For classification, purity is often measured by Gini Impurity. For regression, prediction error is often measured by Mean Squared Error (MSE).
- You can easily build, train, and visualize trees in Python using
scikit-learn, which is crucial for interpretation. Key parameters likemax_depthhelp control complexity and prevent overfitting.
Preview of the Next Lesson:
We've mentioned that the algorithm chooses the "best" split by measuring impurity. But how does that work mathematically? In our next lesson, we will lift the hood and explore the specific split criteria like Gini impurity and Information Gain, giving you the statistical foundation to understand exactly why the tree makes the decisions it does.