Hello! Welcome to the final lesson in our module on classification models.
In our last session, we tackled the important issue of class imbalance, learning how to diagnose it and apply techniques like resampling and class weighting to build more robust models. We saw that not all errors are equal, especially when one class is much rarer or more critical than another.
Today, we will build directly on that idea. Our classification models, like logistic regression, output a probability score between 0 and 1. We've been using a default threshold of 0.5 to convert this probability into a final decision (e.g., if P(spam) > 0.5, classify as spam). But is 0.5 always the right choice? What if the cost of one type of error is vastly different from another?
Your learning outcome for this lesson is to select an appropriate classification threshold based on business objectives. This skill is a crucial bridge between the technical output of a model and its real-world business value, allowing you to justify your choices in a way that stakeholders can understand and appreciate.
Part 1: Beyond the 0.5 Default
A classification threshold is simply the cut-off point you choose to make a decision. For a model that predicts the probability of an event, any instance with a probability above the threshold is assigned to the positive class, and anything below is assigned to the negative class.
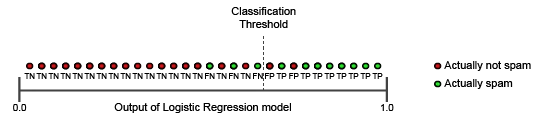
The default threshold of 0.5 treats all errors equally. However, in most real-world applications, the consequences of a False Positive (FP) and a False Negative (FN) are not the same. This imbalance in error costs is the primary reason we need to adjust the threshold.
To understand how, let's first refresh our memory on the precision-recall trade-off.
How to use classification threshold to balance precision ...
The following article, 'How to use classification threshold to balance precision ...' from Evidently AI, provides an excellent explanation of what a classification threshold is and how it creates a trade-off between precision and recall.
Please read the first two sections, 'What is a classification threshold?' and 'Precision-recall trade-off'. Focus on the spam filter example and how adjusting the threshold impacts whether you prioritize precision or recall.
As the article explains:
- Increasing the threshold (e.g., from 0.5 to 0.9) means you require the model to be very confident before predicting the positive class. This leads to fewer positive predictions, which generally increases precision (fewer FPs) but decreases recall (more FNs).
- Decreasing the threshold (e.g., from 0.5 to 0.2) means you are more lenient. This leads to more positive predictions, which generally increases recall (fewer FNs) but decreases precision (more FPs).
The key is that the "optimal" threshold depends entirely on the business problem you are solving.
ROC Curve - how to select the BEST threshold
This video from DataMListic clearly explains why threshold selection is a business decision, using two compelling examples.
Watch the section from 00:39 to 02:03. Pay attention to the contrast between the disease detection model and the employee hiring model.
As you just saw, for disease detection, the cost of a False Negative (missing a sick patient) is extremely high. Therefore, you would want to prioritize high recall and accept lower precision by lowering the threshold. For hiring, the cost of a False Positive (hiring a bad employee) is very high, so you'd want to prioritize high precision by raising the threshold.
Part 2: Tools for Selecting a Threshold
Manually testing different thresholds is inefficient. Instead, we use visualization tools that show a model's performance across all possible thresholds simultaneously.
The ROC Curve
We've already seen the Receiver Operating Characteristic (ROC) curve as a way to measure a model's overall performance (via the AUC). It plots the True Positive Rate (TPR, a.k.a. Recall) against the False Positive Rate (FPR) for every possible threshold.
We can also use the ROC curve to select a threshold. Each point on the curve corresponds to a specific threshold value.
ROC Curve - how to select the BEST threshold
Let's watch the next part of the DataMListic video, which shows how to use the ROC curve to pick a threshold that matches the business needs from the previous examples.
Watch from 02:03 to 05:28. Observe how different points on the ROC curve correspond to different trade-offs between TPR and FPR.
The process involves discussing the desired trade-off with business stakeholders. Do they want to maximize the TPR while keeping the FPR below a certain limit? Do they want to find the point that is furthest from the random-guess diagonal line? The ROC curve provides the map for this discussion.
To solidify your understanding of how the curve is constructed and used, the following video provides a step-by-step walkthrough.
Tutorial 41-Performance Metrics(ROC,AUC Curve) For Classification Problem In Machine Learning Part 2
In this video, Krish Naik demonstrates how an ROC curve is built by calculating TPR and FPR for different thresholds. He then explains how a domain expert would use this graph to make a decision.
Watch from 01:41 to 09:46. Focus on the mechanics of how changing the threshold creates new points on the graph (TPR, FPR pairs) and how a domain expert's priorities ('I want higher true positive rate') guide the final threshold choice.
The Precision-Recall (PR) Curve
While the ROC curve is excellent, the Precision-Recall (PR) curve is often more informative for imbalanced datasets, which we studied in the last lesson. When the number of true negatives is huge, the FPR in an ROC curve can remain deceptively low. A PR curve, which plots precision against recall, doesn't use true negatives and thus often gives a clearer picture of performance on the minority class.

Visualizing the PR curve helps you answer business questions like, "If we need to correctly identify at least 90% of all fraudulent transactions (recall=0.9), what is the highest precision we can achieve, and what threshold gives us that?"
Test your understanding!
You are building a model to send promotional offers to customers who are likely to churn (leave the service).
- A False Positive means you send an offer to a loyal customer who wasn't going to churn. The cost is the price of the offer (e.g., a $10 discount).
- A False Negative means you fail to send an offer to a customer who then churns. The cost is the loss of that customer's future revenue (e.g., $500).
Given this cost structure, should you set your threshold to prioritize high precision or high recall? Explain your reasoning.
Show answer
You should prioritize high recall.
Reasoning: The cost of a False Negative ($500) is significantly higher than the cost of a False Positive ($10). It is much better to send unnecessary offers to a few loyal customers than it is to miss the opportunity to retain a customer who is about to leave. To maximize the number of at-risk customers you identify, you need high recall, which you achieve by lowering the classification threshold.
Part 3: A Quantitative Approach: Cost-Benefit Analysis
Visualizing curves is great for building intuition, but for a truly rigorous business case, you can quantify the decision. This involves creating a profit matrix (or cost matrix) that assigns a specific monetary value to each of the four outcomes in the confusion matrix.
This method allows you to move the conversation from abstract metrics like "precision" to a concrete goal like "maximizing expected profit."
How to Optimize the Classification Threshold
The article 'How to Optimize the Classification Threshold' from KNIME provides a fantastic, in-depth walkthrough of this technique using a credit scoring example.
Please read the article from the beginning down to the 'Results' section. Focus on these key ideas: Why accuracy isn't enough (the cost of mistakes matters). How to define a Profit Matrix based on business hypotheses (Table 1). How to calculate the expected profit for the model. The final result (Table 2), which shows that the threshold that maximizes accuracy is different from the threshold that maximizes profit.
The KNIME article powerfully demonstrates the core idea of this lesson: the "best" model is not necessarily the one with the highest accuracy. The best model, and the best threshold, is the one that best serves the ultimate business goal. By calculating the expected profit for every possible threshold, you can empirically find the single threshold that maximizes financial return and provide a clear, defensible justification for your choice.
Conclusion
Congratulations on completing this module! You have now moved beyond simply building classifiers to critically evaluating and tuning them to meet real-world constraints and objectives.
Key Takeaways:
- The default 0.5 classification threshold is a generic starting point, not an optimal choice for most business problems.
- Selecting a threshold involves a trade-off, most commonly between precision and recall. The right balance depends on the relative costs of False Positives and False Negatives.
- Visual tools like ROC curves and Precision-Recall curves are essential for understanding model performance across all possible thresholds and facilitating discussions with stakeholders.
- The most rigorous method is to perform a cost-benefit analysis. By creating a profit matrix, you can calculate the expected financial outcome for each threshold and select the one that maximizes profit or minimizes cost.
Preview of the Next Module:
We've spent a lot of time with models based on linear boundaries and probabilities, like Logistic Regression and SVMs. In our next module, we will explore a completely different and highly intuitive family of models: Tree-Based Models. We'll begin by learning how to build, visualize, and interpret a single Decision Tree for both classification and regression tasks.