Hello! Welcome back to our exploration of Transformers.
In our last lesson, we built the intuition behind the attention mechanism. We learned that it allows a model to dynamically focus on the most relevant parts of an input sequence by using a "fuzzy dictionary" lookup system with Queries, Keys, and Values. We saw that this involves calculating similarity scores, using softmax to get weights, and then creating a weighted sum of values.
Today, we transition from the what to the how. Our learning outcome is to calculate attention scores using the query, key, and value formulation. We will formalize the concepts from the last lesson into the precise mathematical operations that power the attention mechanism. You'll see how your knowledge of vector and matrix operations from our first module is fundamental to how these large models work.
1. From Embeddings to Q, K, and V
In the last lesson, we treated Queries, Keys, and Values as abstract concepts. In a real Transformer, these are concrete vectors that are created from the initial word embeddings. How does the model generate a query (what to look for) and a key (what I have) from the same initial word?
The answer is through learned linear projections. The model uses three distinct weight matrices, which we'll call , , and . Each input embedding vector () is multiplied by each of these matrices to produce its corresponding query (), key (), and value () vectors.
The crucial point is that the matrices , , and contain parameters that are learned during the training process. This allows the model to learn the optimal way to transform an input embedding for its three different roles:
- Querying: What features of an embedding are useful for finding related information?
- Being Queried (Key): What features should be advertised to attract relevant queries?
- Contributing (Value): What information should be passed along when attention is paid?
To get a deeper intuition for this, let's watch a video that explains the role of these matrices.
The math behind Attention: Keys, Queries, and Values matrices
This video from Serrano.Academy explains that the Key and Query matrices help transform the original embeddings into a new vector space where calculating similarity is more effective for the task.
Watch from 20:40 to 28:38. Focus on the core idea: the Q and K matrices create a specialized space for calculating similarities, while the V matrix creates a specialized space for providing the output content.
For a detailed, step-by-step breakdown of this projection, the following reading is excellent.
Query, Key, Value: The Foundation of Transformer Attention
The article 'Query, Key, Value: The Foundation of Transformer Attention' by Marc Brenndoerfer provides a clear mathematical and code-based explanation of the QKV mechanism. We'll read the first part now.
Read the sections 'The QKV Mechanism: From Intuition to Formula' and 'Step 1: Projecting Into Specialized Spaces'. This will solidify your understanding of how the Q, K, and V matrices are computed from the input embeddings.
2. Calculating Attention Scores: Scaled Dot-Product
Once we have our Query and Key vectors, we need to calculate a similarity score between them. As we discussed previously, the dot product is an efficient way to do this. For an entire sequence of tokens, we can compute all pairwise scores between every query and every key using a single matrix multiplication:
Here, and are matrices where each row is a query or key vector, respectively. This operation leverages the power of GPUs and is a key reason for the efficiency of Transformers.
However, there's a subtle but critical problem. As the dimension of the key vectors () increases, the variance of the dot products also increases. Larger dot product values can push the softmax function (our next step) into regions where its gradient is almost zero. This makes it very difficult for the model to learn effectively.
The solution, introduced in the original "Attention Is All You Need" paper, is simple and elegant: scale the scores. We divide the dot product scores by the square root of the dimension of the key vectors, .
This scaling ensures that the scores have a more stable variance, regardless of the size of , leading to more stable training.
Let's continue with the same article, which provides an excellent statistical justification for this scaling factor.
Query, Key, Value: The Foundation of Transformer Attention
Let's read the next two sections of the 'Query, Key, Value' article. They cover the dot product calculation and, most importantly, the scaling problem and its solution.
Read 'Step 2: Measuring Compatibility with Dot Products' and 'Step 3: The Scaling Problem and Its Solution'. Pay close attention to the derivation that shows why the variance of the dot product is d_k and how scaling fixes this.
3. From Scores to Weights: The Softmax Function
Now that we have our scaled scores, the next step is to convert them into attention weights. These weights represent a probability distribution, indicating how much attention each token should pay to every other token in the sequence. As you know from the previous lesson, we use the softmax function for this.
The softmax function is applied to each row of the scaled score matrix.
The result is a matrix where each entry is between 0 and 1, and each row sums to 1. An entry at position in this matrix represents the amount of attention that token pays to token .
The following video provides a fantastic visualization of this process.
Attention in transformers, step-by-step | Deep Learning Chapter 6
This clip from 3Blue1Brown visually represents the scores as a 'grid of dots' and then shows how a column-wise (or in our case, row-wise) softmax normalizes these scores into an 'attention pattern'.
Watch from 08:22 to 10:18. Focus on how the raw dot-product scores are transformed into normalized weights that represent the attention pattern.
Test your understanding!
Suppose you have a query vector and two key vectors and . The dimension is 2.
- Calculate the unscaled dot product scores between and , and between and .
- Calculate the scaled scores using .
- Apply the softmax function to the scaled scores to get the final attention weights. (You can use a calculator for ).
Show answer
-
Unscaled Scores:
- Score for :
- Score for :
-
Scaled Scores:
- The scaling factor is .
- Scaled score for :
- Scaled score for :
-
Softmax for Attention Weights:
- We apply softmax to the vector of scaled scores: .
- The sum is .
- Attention weight for :
- Attention weight for :
So, token 1 would pay about 80.4% of its attention to token 1 and 19.6% to token 2.
4. The Full Picture: Scaled Dot-Product Attention
We have now assembled all the pieces. The final step is to use these attention weights to create the output. This is done by taking a weighted sum of the Value vectors.
The complete formula for Scaled Dot-Product Attention is:
This single, powerful equation encapsulates the entire process:
- : Compute dot product similarity scores between all queries and keys.
- : Scale the scores for numerical stability.
- : Normalize the scores into attention weights (a probability distribution).
- : Multiply the weights by the Value matrix to get a weighted sum of the values.
The resulting matrix contains the new, contextually enriched representations for each token in the sequence.
The following image provides a great visual summary of this entire flow.
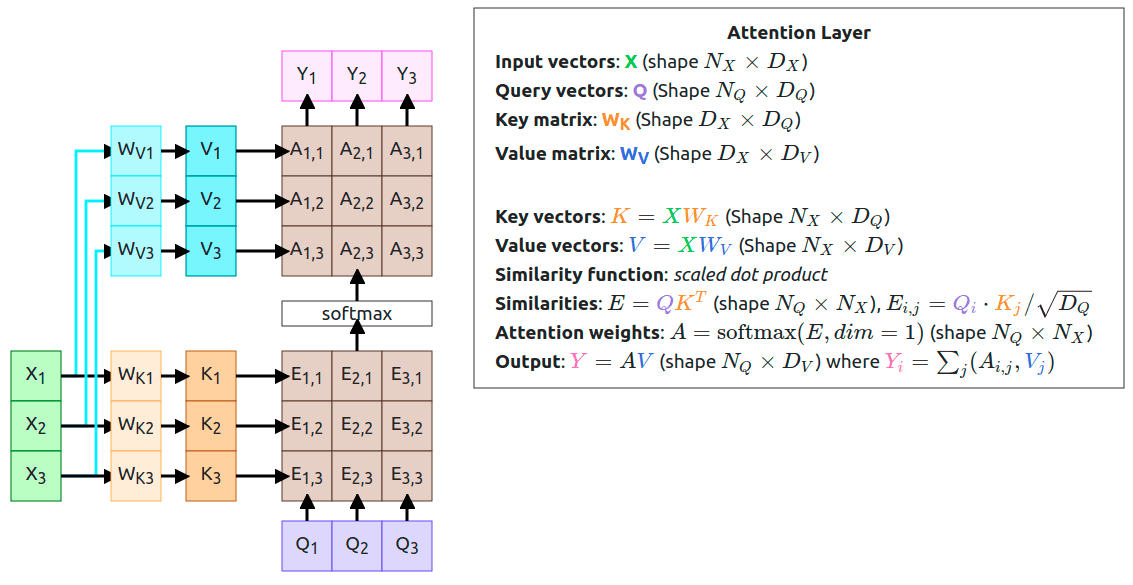
To see this entire process with concrete numbers, the last section of the article we've been reading provides a fantastic worked example.
Query, Key, Value: The Foundation of Transformer Attention
To bring all these steps together, let's look at a complete worked example from the 'Query, Key, Value' article.
Read the final section, 'A Worked Example with Real Words'. Follow the calculations for the sentence 'The cat sat' from the initial embeddings through the QKV projections, score calculations, softmax, and final output.
Conclusion
In this lesson, we have demystified the calculation of attention scores, moving from the high-level intuition of the last session to the concrete matrix operations that are actually performed.
Key Takeaways:
- Projection is Key: Query, Key, and Value vectors are not inherent properties but are created by projecting input embeddings through three learned weight matrices: , , and .
- Scaled Dot-Product is the Core: The similarity score is calculated using a dot product, which is then scaled by to ensure stable training.
- The Full Formula: The entire process is elegantly captured by the scaled dot-product attention formula: .
- Efficiency: These operations are primarily matrix multiplications, which are highly optimized on modern hardware like GPUs, making attention computationally feasible.
Preview of the Next Lesson:
The mechanism we learned today is a single "attention head." But what if a word needs to pay attention to different things for different reasons (e.g., attending to a subject for grammatical agreement and to an adjective for semantic meaning)? The solution is multi-head attention, where the model runs multiple attention heads in parallel, each learning different types of relationships. In our next lesson, we will explore this concept and see how it allows Transformers to capture a much richer set of dependencies.