Hello! Welcome to the seventh lesson in our module on Bayesian methods.
In our last lesson, we applied the full Bayesian framework to linear regression. We saw how specifying priors on our coefficients led to posterior distributions, giving us a complete picture of our model's uncertainty. We also had a glimpse of a profound connection: maximizing the posterior was equivalent to the Ridge and Lasso regularization techniques you've studied.
Today, we will focus entirely on that concept: Maximum A Posteriori (MAP) estimation. You will learn precisely what MAP is, how it provides a powerful bridge between frequentist and Bayesian thinking, and why it's such a fundamental idea in machine learning.
Our goal for this lesson is to explain the concept of Maximum A Posteriori (MAP) estimation. By the end, you'll understand how to incorporate prior knowledge into parameter estimation to build more robust and reasonable models.
1. The Problem with Relying Only on Data: A Limit of MLE
Let's start with a quick thought experiment. Imagine you're tasked with estimating the fairness of a coin. You flip it three times and, just by chance, you get heads every time.
If we use Maximum Likelihood Estimation (MLE), which we've seen before, we find the parameter (the probability of heads, ) that makes our observed data most likely. In this case, the MLE for would be 1.0. This estimate implies that the coin will always land on heads, which seems like a very strong and probably incorrect conclusion based on only three flips.
This simple example highlights a key weakness of MLE: it can be overly sensitive to small or unrepresentative datasets because it has no mechanism to incorporate our common-sense knowledge. This is where MAP estimation comes in.
To see a great explanation of this problem, let's watch the beginning of the following video.
Bayesian Maximum Aposteriori Estimation (MAP): Extending Maximum Likelihood Estimation
In this video, Steve Brunton provides a clear motivation for why we need something more than MLE, using the exact coin-flip example we just discussed.
Watch the first 4 minutes of the video. Pay close attention to how MLE behaves with limited data and how the presenter introduces the idea of using prior knowledge as a solution.
As the video explains, the solution is to use a Bayesian approach to incorporate our prior knowledge—for example, our belief that most coins are reasonably fair.
2. Combining Beliefs and Data: The Heart of MAP
MAP estimation formalizes this process using Bayes' theorem. Recall the theorem, which provides a way to update our beliefs in light of new evidence:
- Likelihood : The same term used in MLE. It asks: "What is the probability of seeing this data, given a specific parameter value ?"
- Prior : This is new. It represents our belief about the parameter before seeing any data. For the coin, our prior might be a probability distribution peaked around .
- Posterior : Our updated belief about after combining the data and our prior.
While full Bayesian inference (like we saw in the last lesson) is concerned with the entire posterior distribution, MAP estimation simply seeks the single most probable parameter value, i.e., the peak or mode of the posterior distribution.
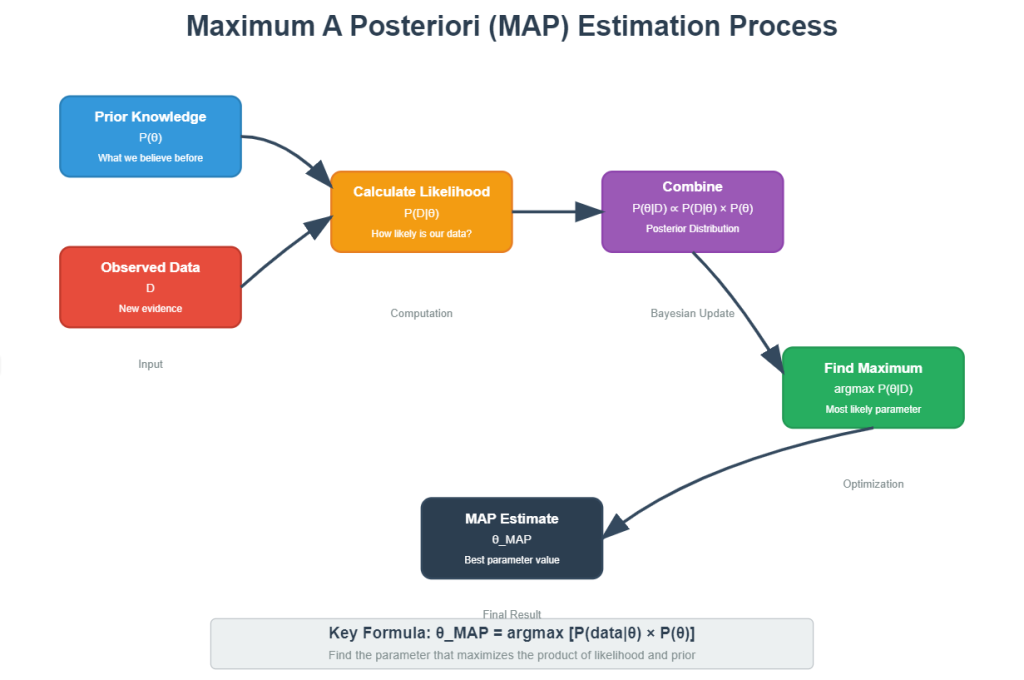
The goal of MAP is to find the that maximizes the posterior probability:
Notice that when we are looking for the value of that maximizes this expression, the denominator is constant with respect to . Therefore, we can ignore it for optimization purposes. This simplifies our goal to:
In plain English, the MAP estimate is the parameter value that maximizes the product of the likelihood and the prior.
This flow diagram provides a great visual summary of the process.
3. MAP in Action: Revisiting the Coin Flip
Let's make this concrete with an example. The following reading provides a fantastic, practical walkthrough.
Maximum A Posteriori (MAP) Estimation – Clearly Explained
This article, 'Maximum A Posteriori (MAP) Estimation – Clearly Explained' from MachineLearningPlus, will guide us through a detailed coin bias example. It visually demonstrates how the prior and likelihood combine.
Read section 4, 'A Real-World Example: Estimating Coin Bias'. Focus on the setup, the comparison between the MLE and MAP estimates, and the excellent visualizations. You can skim the Python code itself, as the plots and the text explain the results clearly.
Let's break down the key insight from that example, where we observe 7 heads in 10 flips.
- The Likelihood function, based purely on the data (7 heads, 3 tails), peaks at the MLE estimate: .
- Our Prior belief is that the coin is probably fair. We can represent this with a Beta distribution that peaks at .
- The Posterior distribution is the result of multiplying the likelihood and the prior. Its peak is a compromise between the two.

An Intuitive View: "Imaginary Flips"
There's a beautifully simple way to think about how priors work in this context, which comes from Tom Mitchell's machine learning book. You can think of a prior as adding "imaginary" data to your observations.
For the coin-flipping problem, a common prior is the Beta distribution. For instance, choosing a Beta(2, 2) prior is mathematically equivalent to adding 1 imaginary head and 1 imaginary tail to our data before calculating the probability.
Let's see the math:
-
MLE Estimate:
where is the count of heads and is the count of tails. -
MAP Estimate with a
Beta(2, 2)prior:
where and are our imaginary heads and tails from the prior.
The MAP estimate is "pulled" away from the MLE of 0.7 towards our prior belief of 0.5. If we have very little data, the prior has a strong influence. If we have a lot of data, the influence of the few imaginary flips becomes negligible, and the MAP estimate will converge to the MLE estimate.
Test your understanding!
Suppose you have a very strong belief that a coin is fair. You might represent this with a prior equivalent to adding 50 imaginary heads and 50 imaginary tails. If you then flip the coin 10 times and get 7 heads, how would the MAP estimate compare to the one we just calculated (0.667)? Would it be closer to 0.5 (your prior) or 0.7 (the MLE)?
Show answer
It would be much closer to 0.5. A stronger prior (more imaginary flips) has more "weight" and will pull the estimate more strongly towards the prior's peak. The new MAP estimate would be .
4. The Connection Between MAP and MLE
You might now be wondering about the relationship between these two estimation methods. As we've hinted, there's a direct link.
MLE is a special case of MAP estimation.
This occurs when we choose a uniform prior. A uniform prior means we believe all possible parameter values are equally likely before seeing the data (e.g., ). If is a constant, then maximizing the product becomes equivalent to maximizing just the likelihood .
So, performing MLE is the same as performing MAP with the assumption of a completely uninformative prior. MAP generalizes this by allowing you to inject your domain knowledge into the estimation problem.
Conclusion
In this lesson, you've explored the core principles of Maximum A Posteriori estimation. It offers a pragmatic and powerful middle ground, blending the data-driven objectivity of MLE with the ability to incorporate prior beliefs from the Bayesian world.
Key Takeaways:
- MAP estimation finds the parameter value that maximizes the posterior probability, .
- It provides a balance between the evidence from the data (likelihood) and our initial beliefs (prior). The mathematical formulation is .
- MAP acts as a form of regularization, preventing the extreme estimates that MLE can produce with limited data by "pulling" the estimate toward the prior.
- MLE is a special case of MAP where the prior distribution is uniform (i.e., we assume no prior knowledge).
Preview of the Next Lesson:
This lesson concludes our module on Bayesian methods! As we move into the next module, Optimization for Machine Learning, we will start by formally defining the role of a loss function. You are now perfectly equipped to understand a deep connection: the MAP estimation objective is often equivalent to minimizing a loss function.
For example, maximizing is the same as minimizing . This expression is precisely a loss function composed of a data-fit term (the negative log-likelihood) and a regularization term (the negative log-prior). We will explore this powerful idea as we begin our journey into optimization.