Hello! Welcome to the first lesson in our module on Optimization for Machine Learning.
In our previous lesson, we worked through the derivations for Maximum Likelihood Estimation (MLE). A key takeaway was that finding the best parameters for a model often means minimizing the Negative Log-Likelihood (NLL). This NLL, which measures how "unlikely" the data is given our model, is a perfect example of the concept we'll formalize today.
This lesson addresses the learning outcome: Explain the role of a loss function in quantifying model error. A loss function is the central component in training almost any machine learning model. It acts as both a scorekeeper and a guide, telling the model how wrong its predictions are and providing a signal on how to get better. For you, understanding this is fundamental to explaining why a particular model training process works.
What is a Loss Function?
At its core, a loss function is a mathematical rule that assigns a numerical "cost" or "penalty" to a model's incorrect prediction. Imagine you are training a model to predict house prices. If the model predicts a price of $350,000 for a house that actually sold for $375,000, the loss function quantifies the "badness" of that $25,000 error.
The goal of training is to find the model parameters (like the coefficients in a linear regression) that make the total loss, aggregated over all examples in your training data, as small as possible.
To build a strong intuition, let's start with a video that uses a simple, real-world analogy.
Cost Function and Loss Function in Data Science | Cost function machine learning | Regression Cost
This video from Unfold Data Science provides an excellent analogy for understanding loss functions and clearly distinguishes between a 'loss function' and a 'cost function'—a common point of confusion.
Please watch the following segments: From 0:32 to 2:06, focusing on the Google Maps analogy of choosing a route (a decision) and its associated travel time (the cost). From 2:06 to 3:44, to see how this idea is applied to a simple linear regression model. From 6:07 to 6:51, to grasp the critical difference between a 'loss' and a 'cost'.
Loss vs. Cost: A Key Distinction
As you saw in the video, the terms loss function and cost function are often used interchangeably, but there's a subtle and important difference that's good to know:
- Loss Function: This is calculated for a single training example. It measures the error for one prediction.
- Cost Function: This is the average of the loss calculated over the entire training dataset. The cost function gives us a single number that represents the overall performance of the model on all the data we're using to train it.
In machine learning, our ultimate goal is to minimize the cost function. By doing so, we are tuning the model's parameters to achieve the lowest possible average error across all our data.
The following article provides a concise written summary of these ideas.
Loss Functions in Machine Learning Explained
The article 'Loss Functions in Machine Learning Explained' from DataCamp reinforces the concepts we've just discussed.
Please read the section titled 'What Is a Loss Function?'. Pay close attention to the paragraphs that explicitly define and differentiate the loss function and the cost function.
The Two Primary Roles of a Loss Function
A loss function isn't just a static score; it plays two active roles in the machine learning lifecycle. The IBM Technology video you'll watch next uses a practical example of predicting YouTube views to illustrate these two roles perfectly.
What is a Loss Function? Understanding How AI Models Learn
This video, 'What is a Loss Function?', explains its dual role as both a performance metric and a guide for learning.
Please watch these two key parts: From 1:06 to 2:18, to see how the loss function acts as a scorekeeper to evaluate model performance. From 8:01 to 9:15, to understand how it acts as a guide for the model's learning process through optimization.
Let's break down these two roles:
1. Scorekeeper (Evaluation): The loss function provides a clear, quantitative metric of model performance. By comparing the cost function value before and after an adjustment to the model, we can objectively say whether the change made the model "better" or "worse." A lower loss means the model's predictions are, on average, closer to the true values.
2. Guide (Optimization): This is the more crucial role. The loss function provides the signal used to update the model's parameters. For most loss functions, we can calculate their derivative (or gradient, for multiple parameters). This derivative tells us how the loss would change if we slightly nudged a model parameter. An optimization algorithm, like the Gradient Descent we will study next, uses this information to "steer" the parameters in the direction that causes the steepest decrease in loss. For this to work, the loss function must be differentiable.
Common Loss Functions for Different Tasks
The choice of loss function is not arbitrary; it depends on the type of problem you are solving. Let's look at the two main categories: regression and classification.
1. Loss Functions for Regression
In regression, the goal is to predict a continuous value (e.g., price, temperature). You are already familiar with the two most common loss functions from your basic statistics background.
-
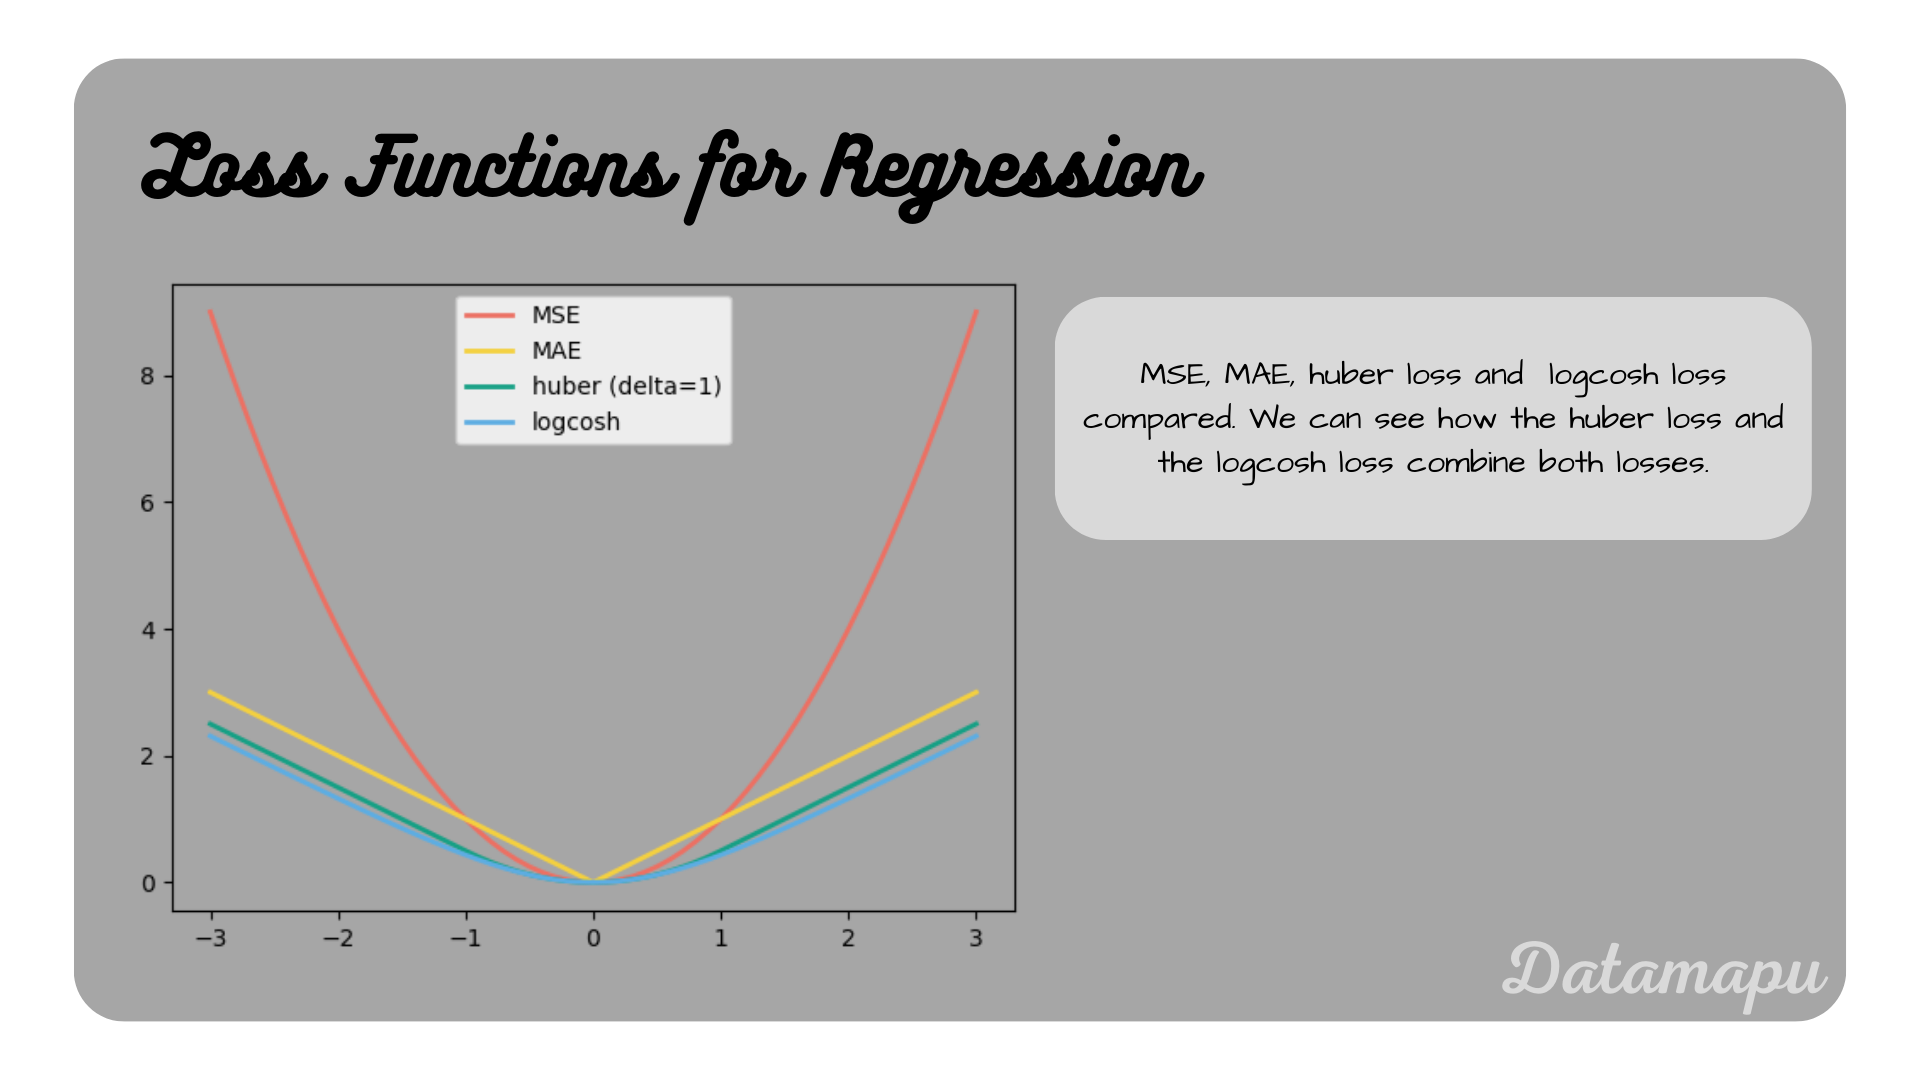
Mean Squared Error (MSE): The loss for a single prediction is the square of the difference between the true value () and the predicted value ().
Because the error is squared, MSE heavily penalizes large errors. This makes it sensitive to outliers. -
Mean Absolute Error (MAE): The loss is the absolute difference between the true and predicted values.
Since the error is not squared, MAE is less sensitive to outliers compared to MSE.
The following video segment explains the trade-offs between these two.
What is a Loss Function? Understanding How AI Models Learn
Let's return to the IBM Technology video to see a comparison of regression loss functions.
Watch the segment from 2:18 to 4:18. It covers MSE, MAE, and Huber Loss, and discusses when you might choose one over the other.
This image provides a powerful visual comparison of how different regression loss functions penalize errors.
2. Loss Functions for Classification
In classification, the goal is to predict a discrete category (e.g., "spam" or "not spam"). Here, a simple difference is not meaningful. Instead, we measure the "distance" between the predicted probabilities and the true class labels.
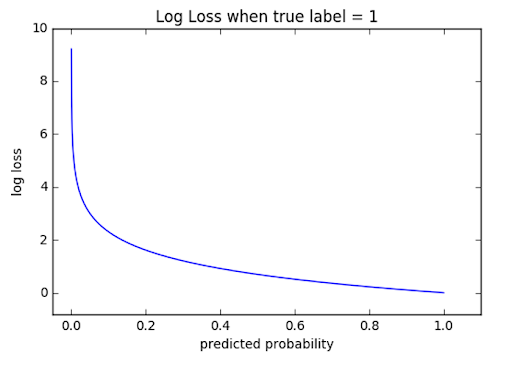
- Log Loss (Binary Cross-Entropy): This is the most common loss function for binary classification. It heavily penalizes predictions that are both confident and wrong.
This brings us full circle to our last lesson on MLE. The Negative Log-Likelihood of a model with a Bernoulli-distributed outcome is exactly the Log Loss/Binary Cross-Entropy! This is a key link between statistical principles and machine learning practice.
The loss for a single example is given by:
Where is the true label (0 or 1) and is the model's predicted probability of the class being 1.
Let's see how this works:
- If the true label is 1 (), the loss becomes . The loss is 0 if (perfect prediction) and goes to infinity as approaches 0 (confidently wrong).
- If the true label is 0 (), the loss becomes . The loss is 0 if and goes to infinity as approaches 1.
This graph perfectly illustrates the case where the true label is 1.
Test your understanding!
Suppose you are building a model to detect a rare but critical disease. You want to avoid a situation where the model is very confident a patient is healthy ( is close to 0) when they actually have the disease (). Which regression loss function, MSE or MAE, has a penalization behavior that is more philosophically similar to Log Loss in this high-stakes scenario?
Show answer
MSE. Both Log Loss and MSE disproportionately penalize large errors. In the Log Loss graph, you can see the penalty shoots up dramatically as the prediction gets further from the truth. Similarly, MSE's quadratic nature means a large error (e.g., an error of 10) is penalized 100 times more than a small error (an error of 1), not just 10 times more like in MAE. This behavior of heavily punishing egregious mistakes is shared by both, even though they are used for different tasks.
Conclusion
In this lesson, we have formally defined the role of a loss function as the core driver of a machine learning model's training process.
Key Takeaways:
- A loss function quantifies the error for a single prediction, while a cost function averages this error over the entire dataset.
- Loss functions have two primary roles: as a scorekeeper to evaluate model performance and as a guide to provide a signal for optimization.
- The choice of loss function is tied to the task. MSE and MAE are common for regression, while Log Loss (Cross-Entropy) is standard for classification.
- The concept of Log Loss is directly connected to the principle of Maximum Likelihood Estimation, as it is equivalent to the Negative Log-Likelihood for binary outcomes.
Preview of the Next Lesson:
Now that we know what we need to minimize—the cost function—the next logical question is how do we minimize it? In our next lesson, we will dive into Gradient Descent, the fundamental iterative algorithm that uses the "guide" role of the loss function to systematically find the model parameters that result in the lowest possible loss.