Hello! Welcome back to our module on Unsupervised Learning.
In our last lesson, we explored how to interpret the results of PCA by examining explained variance and component loadings. We learned that the explained variance tells us how much information each principal component (PC) captures, and that component loadings reveal the underlying meaning of these new dimensions. This set us up for a crucial decision in any PCA workflow: how many principal components should we actually keep?
Today's lesson directly addresses that question, fulfilling the learning outcome: Use scree plots to select the optimal number of principal components. A scree plot is a simple yet powerful tool that visualizes the explained variance, helping you make a data-driven decision about the trade-off between dimensionality reduction and information retention. This is a core skill for justifying your modeling choices in a machine learning project.
By the end of this lesson, you will be able to create and interpret a scree plot using several common heuristics to choose the right number of components for your model.
1. What is a Scree Plot?
At its heart, a scree plot is a simple line plot or bar chart that shows the eigenvalues (or the percentage of variance explained) for each principal component, ordered from largest to smallest. The name comes from a geology term, "scree," which refers to the pile of broken rock fragments at the base of a cliff. The plot often resembles a cliff-face, with a steep drop-off followed by a flatter "rubble" area.
StatQuest: Principal Component Analysis (PCA), Step-by-Step
To see what this looks like, let's turn to the 'StatQuest' video we've used before. It provides a great visual introduction to the scree plot and connects it directly to the concept of explained variance.
Please watch from 15:06 to 16:20 to see how explained variance is calculated and formally defined as a scree plot. Then, jump to 18:08 - 18:57 to see it applied to a 3-variable example.
As the video illustrates, the scree plot helps us quickly visualize the importance of each component. The first few components (the "cliff") capture a large amount of variance, while the later components (the "scree") contribute much less.
Here is a typical example of what a scree plot looks like:
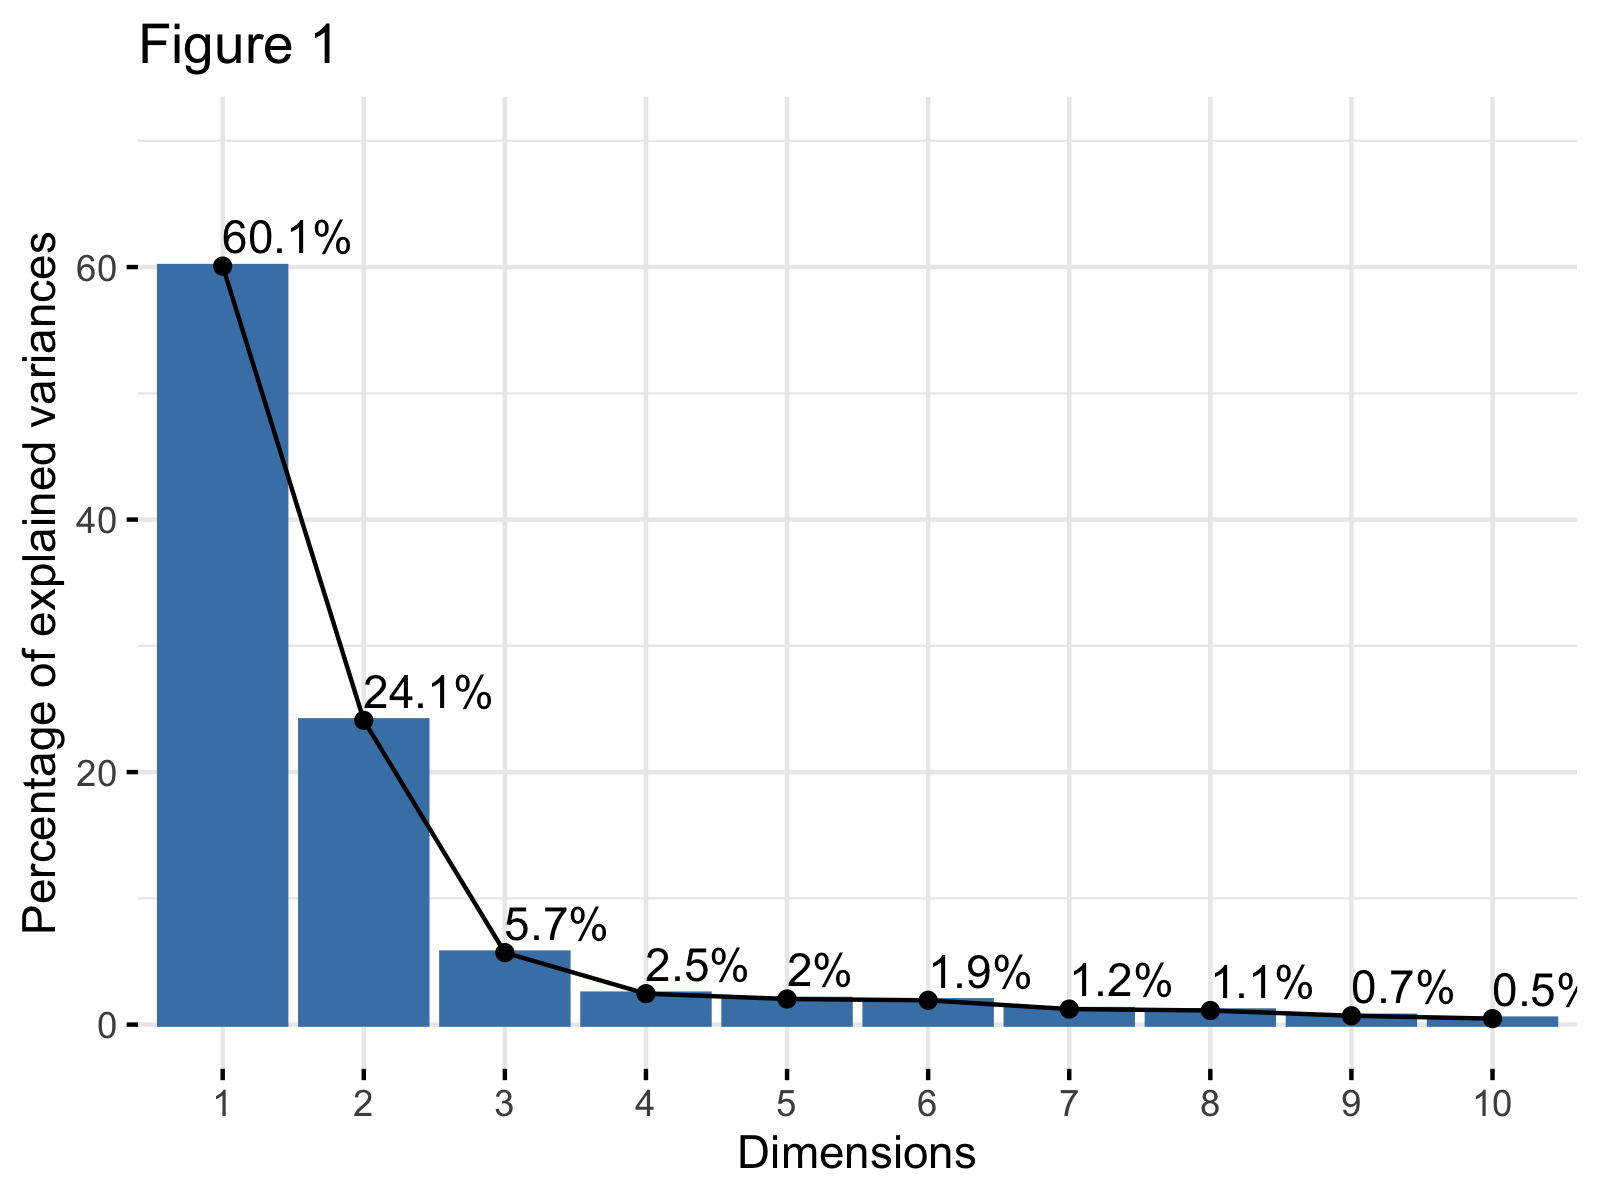
The y-axis shows the percentage of variance explained, and the x-axis lists the principal components. The goal is to find the "point of diminishing returns"—the point where adding another component doesn't give us much new information.
2. Methods for Selecting the Number of Components
Looking at a scree plot is one thing, but how do you formally decide on the number of components? There are several common heuristics, or rules of thumb, that can guide your decision. Let's explore three of the most popular ones.
Method 1: The Elbow Method
This is the most intuitive method and relates directly to the "cliff and scree" analogy. You look for the "elbow" in the plot—the point where the steep decline flattens out. The number of components at this elbow point is often considered the optimal number to retain. The components before the elbow are the ones that capture the most significant variance.
Principal Component Analysis Guide & Example
This article from 'Statistics By Jim' gives a very clear explanation and example of the elbow method.
Please read the short section titled 'How Many Components?' and examine the accompanying scree plot. Notice how the author identifies that the 'flat portion of the curve begins at component 4', leading to the conclusion that three components should be used.
The main advantage of the elbow method is its simplicity. However, it can be subjective. Sometimes there is no clear elbow, or there might be multiple "elbows," making the choice less obvious.
Method 2: Cumulative Explained Variance Threshold
Instead of looking for an elbow, you can set a specific threshold for the total amount of variance you want to preserve. Common thresholds are 90%, 95%, or 99%.
To use this method, you plot the cumulative explained variance. This plot shows the percentage of total variance captured by the first k components. You then select the minimum number of components required to cross your desired threshold.

This method is less subjective than the elbow method because you set a clear, quantitative goal. The choice of threshold depends on your specific application. For data visualization, you might be happy with 80-90%. For input to a downstream machine learning model, you might want to retain 95% or even 99% to avoid losing potentially predictive information.
Principal Component Analysis (PCA): Complete Guide
The 'Principal Component Analysis (PCA): Complete Guide' resource offers a fantastic interactive tool to help you build intuition for this method.
Read the sections 'Choosing K Components' and 'Cumulative Variance'. Then, play with the 'Interactive: Scree Plot' section. Adjust the 'Target' variance slider and observe how the number of required components changes. This will give you a feel for the trade-off.
Method 3: Kaiser's Rule (Eigenvalue > 1)
Kaiser's rule provides a simple, objective criterion: keep only the principal components with an eigenvalue greater than 1.
The intuition behind this rule comes from working with standardized data. When you standardize your dataset before PCA (which is standard practice), each original variable has a variance of 1. Therefore, any principal component with an eigenvalue less than 1 is capturing less variance than a single original variable. The argument is that such a component is not contributing significant information and can be discarded.
This rule is easy to apply and removes all subjectivity. However, it is also considered by some statisticians to be too rigid and can sometimes lead to keeping too many or too few components compared to the other methods.
Test your understanding!
You run PCA on a standardized dataset with 10 original variables. The eigenvalues for the components are:
[3.5, 2.8, 1.1, 0.8, 0.6, 0.4, 0.3, 0.2, 0.15, 0.15]
How many components would you keep according to Kaiser's rule?
Show answer
You would keep 3 principal components, because only the first three components (with eigenvalues 3.5, 2.8, and 1.1) have an eigenvalue greater than 1.
3. Practical Application in Python
Now let's see how these methods are applied in practice. The following video demonstrates how to generate a scree plot and use both the elbow method and Kaiser's rule to select the number of components for a real dataset using Python's scikit-learn library.
Principal Component Analysis in Python | How to Apply PCA | Scree Plot, Biplot, Elbow & Kaisers Rule
This video from 'Statistics Globe' walks through the entire process of choosing the number of components in Python.
Please watch from 5:31 to 9:46. Pay attention to the following steps: Running PCA with all components to get the variance information (5:31-6:43). Creating a scree plot and applying the elbow method (6:43-8:39). Applying Kaiser's rule by plotting the raw eigenvalues and comparing them to a threshold of 1 (8:39-9:46).
As the video shows, the process is quite straightforward:
- Initialize and fit a PCA model on your scaled data, keeping all components for the initial analysis (
n_components=None). - Extract the explained variance ratio (
pca.explained_variance_ratio_) or the raw eigenvalues (pca.explained_variance_). - Plot these values to create your scree plot.
- Apply your chosen heuristic (elbow, cumulative variance, or Kaiser's rule) to decide on the optimal number, k.
- Finally, you would run PCA again, but this time setting
n_components=kto get your final, transformed dataset.
Conclusion
In this lesson, you learned how to use one of the most important diagnostic tools for Principal Component Analysis: the scree plot. Making an informed decision about the number of components to keep is fundamental to using PCA effectively.
Key Takeaways:
- A scree plot visualizes the variance explained by each principal component, in descending order.
- The elbow method suggests choosing the number of components at the "bend" in the plot where the curve flattens.
- The cumulative variance threshold method involves choosing enough components to retain a desired percentage of the total variance (e.g., 95%).
- Kaiser's rule provides an objective guideline: keep components with an eigenvalue greater than 1.
- The choice is often a balance between simplicity (fewer components) and information retention (more components), and it's good practice to consider multiple heuristics.
Preview of the Next Lesson:
We have now concluded our deep dive into PCA, a powerful technique for dimensionality reduction. We will now shift our focus to another major pillar of unsupervised learning: clustering. In the next lesson, we will begin exploring how to find natural groupings in data by learning to apply the k-means algorithm to partition data into clusters.