Hello! Welcome to the first lesson of Module 3: Optimal Entry Framework.
In the previous module, we focused on identifying the institutional footprints of Order Blocks (OBs) and Fair Value Gaps (FVGs). You learned how they are formed and how their confluence creates high-probability points of interest. We concluded by noting that these concepts help us find where institutions have acted, but not necessarily the most precise level to enter a trade.
This lesson begins our journey to answer that question. Our learning outcome is to define a trading range and identify its equilibrium (50%) level. This is the foundational step in understanding the ICT concept of price being either "cheap" or "expensive." By framing the market in this way, you can begin to position yourself on the same side as institutional players, who aim to buy at a discount and sell at a premium. This logic is not only crucial for discretionary trading but also forms a core rule for any trading algorithm you might develop.
1. What is a Trading Range?
At its core, an ICT Dealing Range or Trading Range is the price span between a significant swing high and a significant swing low. It's the "field of play" where price is currently operating. Within this range, institutions execute their accumulation (buying) and distribution (selling) campaigns.
The most important concept within this range is Equilibrium.
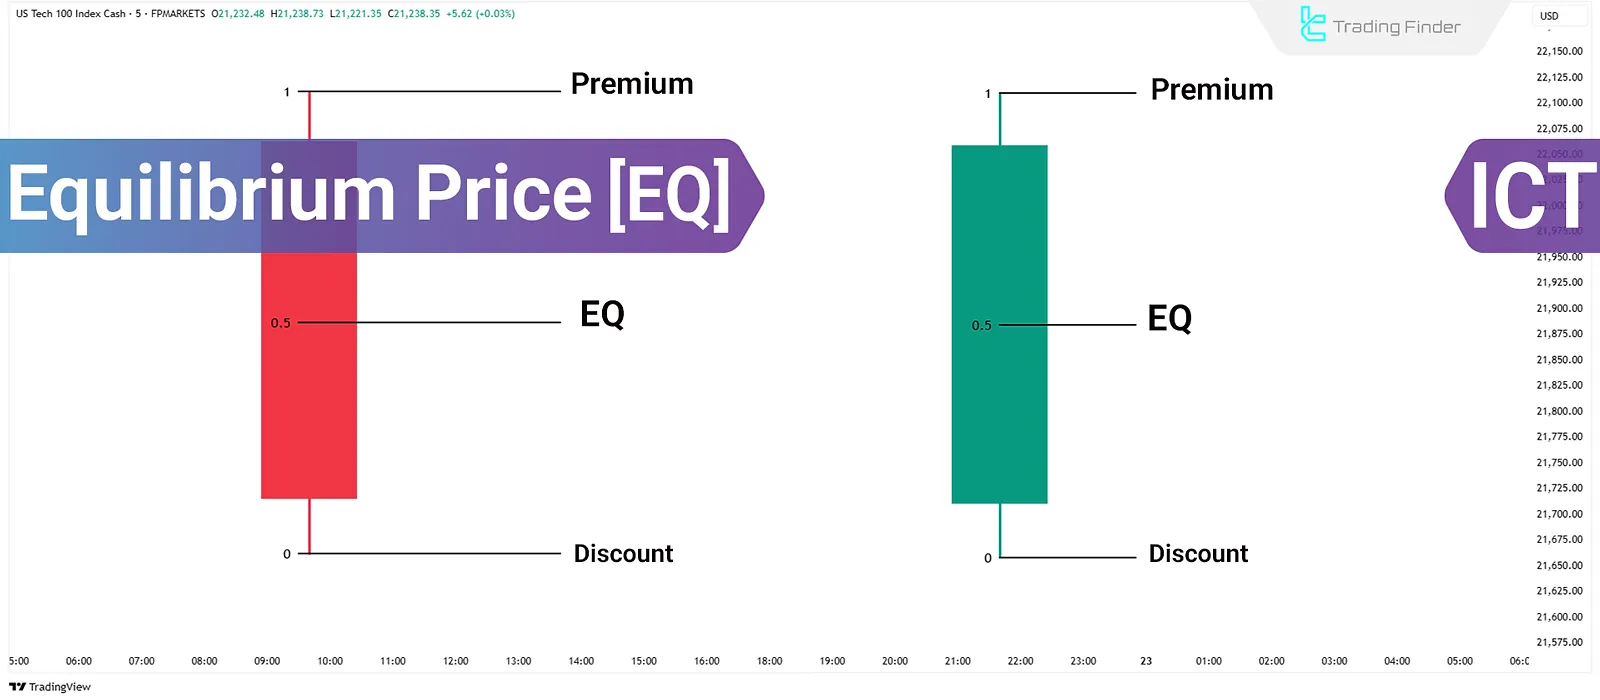
Why is this important? Smart money aims to operate with maximum efficiency:
- They prefer to sell when the price is expensive (at a Premium).
- They prefer to buy when the price is cheap (at a Discount).
By identifying this framework on your chart, you can start to think in the same terms.
Understanding ICT Dealing Ranges – Smart Money Trading
For a solid textual definition, let's turn to the article 'Understanding ICT Dealing Ranges – Smart Money Trading' from WritoFinance.
Please read the introduction and the section 'Understanding Key Elements of a Dealing Ranges'. This will formally define the dealing range and its components: swing high/low, premium, discount, and equilibrium.
2. How to Define a Trading Range
A trading range isn't just any high and low; it's typically established by a clear, impulsive price move that breaks market structure.
- A bullish range is often set after price makes a strong move up, creating a Break of Structure (BOS) to the upside. The range is then defined by the swing low that initiated the move and the new swing high that was formed.
- A bearish range is set after a strong move down creates a BOS to the downside. The range is defined by the swing high that started the move and the new swing low that was formed.
The following video provides a more detailed, practical guide on how to identify these ranges as they form in a live market.
ICT Dealing Range Theory (DRT) Simplified & Explained - How to Find ICT Dealing Range
The video 'ICT Dealing Range Theory (DRT) Simplified & Explained' by Ali Khan offers an excellent, structured explanation of how to define trading ranges in both bullish and bearish conditions.
Please watch the sections on the bearish and bullish dealing ranges. Watch from 02:04 to 04:46 for the bearish dealing range example. Notice how the range is defined after price breaks a low. Then, watch from 08:11 to 09:06 for the bullish dealing range example. See how the range is set between the low that swept liquidity and the high that broke structure.
As the video demonstrates, the process is dynamic. When a new Break of Structure occurs, your previous trading range is invalidated, and you must define a new one based on the latest price action.
3. Finding the Equilibrium (50%) Level
Once you have your trading range defined by a swing high and a swing low, finding the equilibrium is straightforward. This 50% level acts as the "fair value" price for the range.
There are two primary methods to find it:
1. The Visual Method: Fibonacci Tool
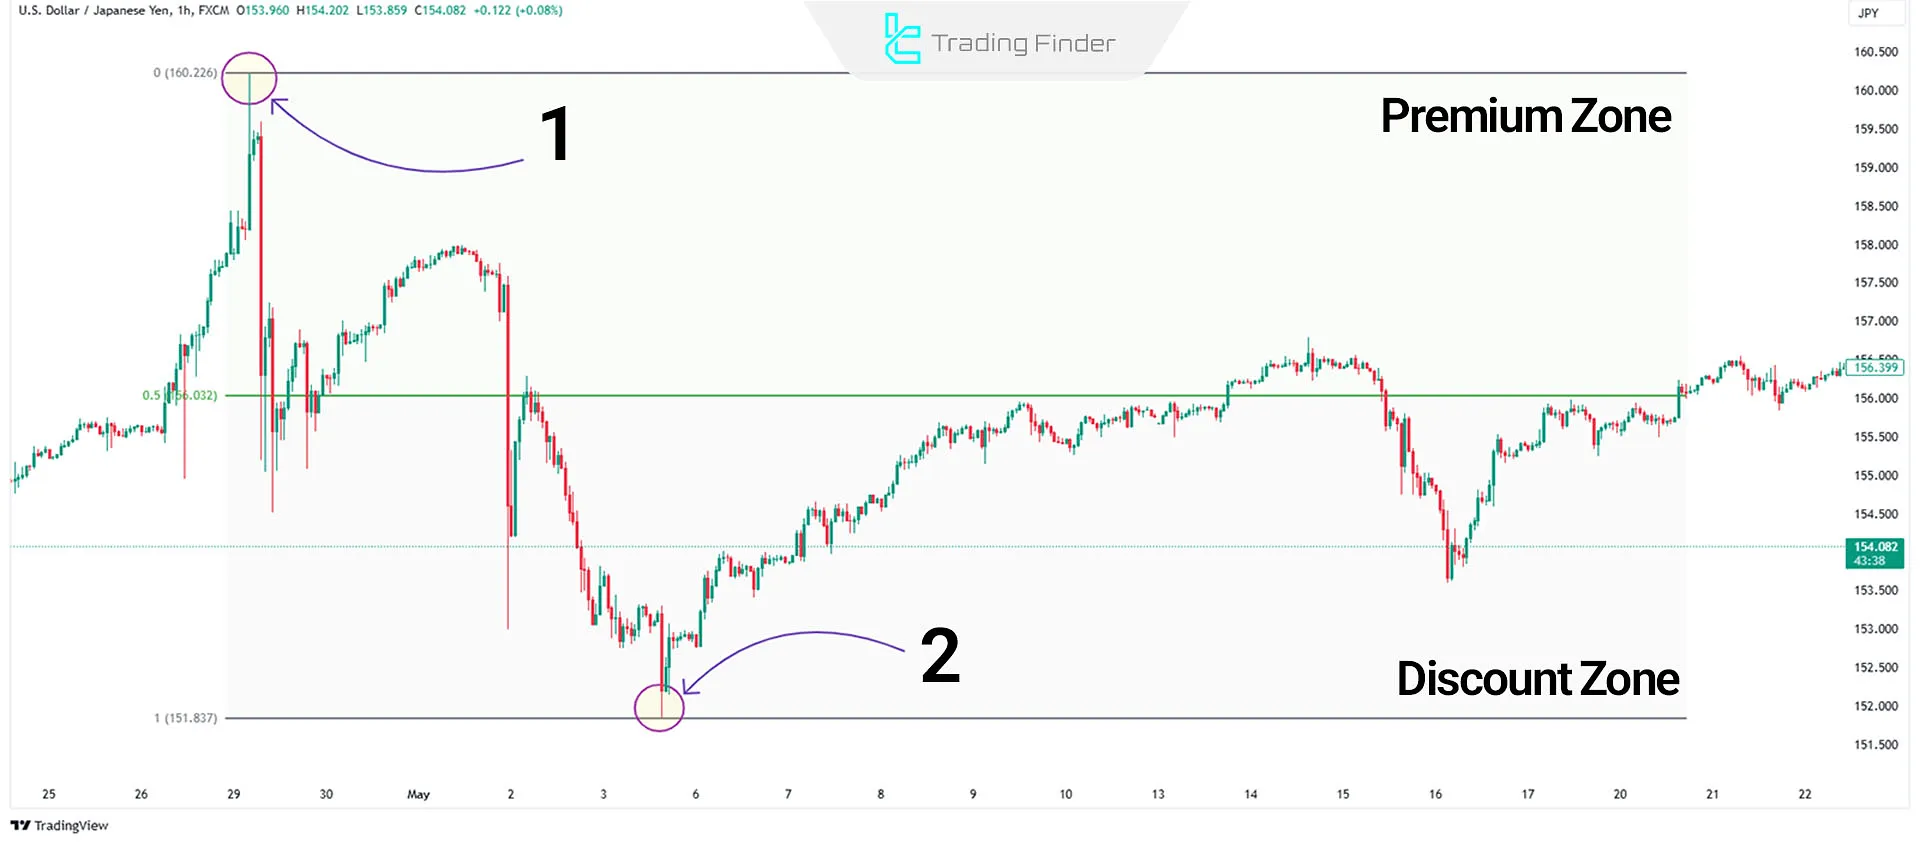
This is the most common way traders identify equilibrium. By drawing a Fibonacci retracement tool from one end of the range to the other, the 0.5 level will mark the exact midpoint.
2. The Mathematical Method: Midpoint Formula
This method is less visual but is exactly how you would program a trading bot to perform this calculation. The logic is simple:
This formula gives you the precise price of the 50% level.
Discount & premium zones in ICT trading - Equiti
The article 'Discount & premium zones in ICT trading' from Equiti provides a very clear breakdown of these zones and reinforces the methods for finding the equilibrium.
Please read the two short sections: 'How to identify premium area' and 'How to identify discount area'. Pay close attention to the simple mathematical formula provided for the midpoint, as this is key for automation.
Test your understanding!
Let's use the price levels from the chart example above (LINK).
A trading range on USD/JPY is defined by:
- Swing High:
160.226 - Swing Low:
151.837
- Using the mathematical formula, calculate the Equilibrium price.
- If the current price of USD/JPY is
157.500, is it trading in a premium or a discount?
Show answer
-
Equilibrium Calculation:
The equilibrium price is approximately156.032. -
Premium or Discount?
The current price of157.500is above the equilibrium price of156.032. Therefore, the price is currently in a premium zone. From an ICT perspective, this would be a more favorable area to look for selling opportunities than buying opportunities.
Conclusion
In this lesson, you've learned to apply the first layer of the Optimal Entry Framework. By defining a trading range and its equilibrium point, you can now view price through the institutional lens of "cheap" vs. "expensive."
Key Takeaways:
- A trading range is the price action between a significant swing high and swing low, often established after a Break of Structure.
- The Equilibrium (EQ) is the 50% midpoint of this range, representing its "fair value."
- Prices above the EQ are in a Premium zone, which is favorable for selling.
- Prices below the EQ are in a Discount zone, which is favorable for buying.
- The EQ can be calculated with the formula:
(High + Low) / 2, a key piece of logic for future automation.
Preview for the Next Lesson:
Knowing whether the price is in a premium or discount is a huge step forward. But where exactly in that large zone should you look to enter? In the next lesson, we will narrow our focus and learn to identify premium zones for optimal sell entries and identify discount zones for optimal buy entries. We will start to combine this range framework with the FVG and OB concepts from the previous module to find high-probability setups.