Hello! Welcome to your next lesson in the "Working with Market Data in Python" module.
In our last lesson, we covered the high-level process of selecting a market data API and configured our environment to connect to a professional broker like OANDA. You learned the importance of security by storing your API keys in a separate file and saw how API wrappers simplify the connection process.
Today, we get our hands dirty with the code. Our goal is to write a Python script to fetch historical OHLCV data for a specified asset. This is the absolute cornerstone of any trading bot or analysis script. While broker APIs are essential for live trading, for analysis, backtesting, and learning, we can start with simpler, free libraries that are purpose-built for historical data.
This lesson will equip you with the practical Python skills to download the exact price data you need for any asset on any timeframe—the raw material for all the ICT analysis we'll do later.
Part 1: Fetching Data with yfinance
The most common starting point for fetching financial data in Python is the yfinance library. It's a free, powerful tool that pulls data from Yahoo Finance. Since you have no prior programming experience, we'll start here because of its simplicity and excellent documentation.
First, let's ensure you have the necessary libraries installed. Open your terminal or command prompt (with your virtual environment activated) and run:
pip install yfinance pandas
Now, we can write a script to download data. The article below provides an excellent walkthrough of the entire process.
How to download market data with yfinance and Python
The article 'How to download market data with yfinance and Python' from PythonFinTech is a clear and concise guide. It will walk you through writing your first script to download data for a single stock.
Please read the section 'Downloading market data for a single ticker'. Pay close attention to: The import statements at the beginning. The yf.download() function and its main parameters: tickers, start, end, and interval. The structure of the output. Notice how it's a table with 'Date' as the index and columns for Open, High, Low, Close, and Volume (OHLCV).
As the article demonstrates, the core of this process is the yf.download() function. Let's break down a simple example. Create a new Python file (e.g., fetch_data.py) and add the following code:
# Import the yfinance library, giving it a shorter alias 'yf'
import yfinance as yf

# Define the ticker for the asset we want
# Let's use the SPY ETF, which tracks the S&P 500 index
ticker = "SPY"

# Use the download function to get the data
data = yf.download(
    tickers=ticker,
    start="2023-01-01",
    end="2023-12-31",
    interval="1d"  # '1d' means daily data
)

# Print the last 5 rows of the downloaded data
print(data.tail())
When you run this script, you'll see a table printed to your console, similar to the one below. This is a pandas DataFrame, the standard object for handling tabular data in Python.
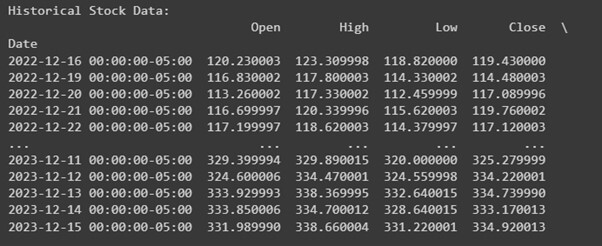
Each row represents one day, and the columns give you the Open, High, Low, and Close prices for that day, along with the trading Volume.
Part 2: A Closer Look at yfinance Parameters
The yf.download() function is flexible. You can customize it to get precisely the data you need for your ICT analysis.
To see this in action, the following video provides a great visual demonstration.
yfinance Python Tutorial: Get Free Market Data
The video 'yfinance Python Tutorial' from the Analyzing Alpha channel provides a quick, practical demonstration of the library's features.
Watch from 02:25 to 06:15. The video will show you: How to specify different intervals (like '1m' for minute data). How to download data for multiple tickers at once (['GOOG', 'META']). How the resulting DataFrame is structured when you have multiple tickers.
Let's summarize the key parameters:
tickers: Can be a single string like"EURUSD=X"(for the EUR/USD forex pair) or a list of strings like["AAPL", "MSFT", "NVDA"].interval: This is crucial for multi-timeframe analysis in ICT. You can use values like:- Minute data:
"1m","5m","15m" - Hourly data:
"1h" - Daily/Weekly/Monthly:
"1d","1wk","1mo"
- Minute data:
startandend: Defines the date range. You can also useperiodfor a relative timeframe, likeperiod="1y"for one year of data.
Test your understanding!
Modify the script from Part 1 to download the last three months of 4-hour (4h) data for Bitcoin (BTC-USD). You might need to adjust the yfinance parameters to fetch intraday data. Hint: For intraday data, yfinance has limitations on date ranges. You might need to use the period parameter instead of start and end.
Show answer
import yfinance as yf

# For intraday data, yfinance often works best with the 'period' parameter
# '3mo' specifies a three-month period.
data = yf.download(
    tickers="BTC-USD",
    period="3mo",
    interval="4h"
)

print(data.head()) # Print the first few rows
print(data.tail()) # Print the last few rows
Note: Yahoo Finance has limitations on how much historical intraday data you can access for free. For extensive backtesting, a paid data source or a broker API is usually necessary.
Part 3: An ICT-Centric Alternative: tvdatafeed
While yfinance is great, its coverage of futures and non-US forex pairs can sometimes be limited or delayed. Since your interest lies in ICT concepts often applied to forex and index futures (like ES/NQ), there's a fantastic alternative: tvdatafeed.
This library cleverly scrapes data directly from TradingView—the platform you likely use for manual charting. This means the data you pull into Python will match what you see on your charts, which is a huge advantage for consistency.
Let's see how to use it. First, install the library:
pip install tvdatafeed
The following video provides a complete guide to getting started.
download #historical data from #Tradingview into #python
The video 'download #historical data from #Tradingview into #python' from the Stock Data Analysis channel is perfect for your goals. It demonstrates how to get data for indices, futures, and stocks directly from TradingView.
This video is highly relevant, so watch from 01:04 to 08:25. Focus on these key steps: Installation and setup: How to install and import the library. Fetching data: The syntax for tv.get_historical_data(). Parameters: How to specify the symbol, exchange, interval, and number of bars (n_bars). Futures contracts: Pay special attention to how it fetches data for futures, which will be vital for analyzing index price action.
Here's an example script based on the video, tailored for your interests:
from tvdatafeed import TvDatafeed, Interval

# Initialize the connection (no login needed for historical data)
tv = TvDatafeed()

# Fetch the last 2000 15-minute candles for the E-mini S&P 500 futures
# Symbol: ES
# Exchange: CME (Chicago Mercantile Exchange)
es_data = tv.get_hist(
    symbol='ES',
    exchange='CME',
    interval=Interval.in_15_minute,
    n_bars=2000
)

print("E-mini S&P 500 (ES) 15-min data:")
print(es_data)

# Fetch the last 2000 1-hour candles for EUR/USD
# Symbol: EURUSD
# Exchange: OANDA (or another forex broker available on TradingView)
eurusd_data = tv.get_hist(
    symbol='EURUSD',
    exchange='OANDA',
    interval=Interval.in_1_hour,
    n_bars=2000
)

print("\nEUR/USD 1-hour data:")
print(eurusd_data)
This is incredibly powerful. You now have a script that can pull the exact same data you use for your manual ICT charting, ready for programmatic analysis.
Part 4: Building a Reusable Function
As you start building more complex scripts, you'll want to avoid copying and pasting the same data-fetching code over and over. In programming, we solve this by creating functions. A function is a reusable block of code that performs a specific task.
Let's create a simple function that wraps our yfinance call.
import yfinance as yf
from datetime import datetime

def fetch_ohlcv_data(ticker, start_date, end_date, interval):
    """
    Fetches historical OHLCV data for a given ticker.

    Args:
        ticker (str): The ticker symbol to fetch (e.g., 'SPY').
        start_date (str): The start date in 'YYYY-MM-DD' format.
        end_date (str): The end date in 'YYYY-MM-DD' format.
        interval (str): The data interval (e.g., '1d', '1h', '15m').

    Returns:
        pandas.DataFrame: A DataFrame containing the OHLCV data, or None if download fails.
    """
    print(f"Fetching {interval} data for {ticker} from {start_date} to {end_date}...")
    try:
        data = yf.download(
            tickers=ticker,
            start=start_date,
            end=end_date,
            interval=interval,
            progress=False # Hides the download progress bar
        )
        if data.empty:
            print(f"No data found for {ticker}. It may be an invalid ticker or date range.")
            return None
        return data
    except Exception as e:
        print(f"An error occurred: {e}")
        return None

# --- How to use the function ---
if __name__ == "__main__":
    # Example 1: Get daily data for Apple
    aapl_daily = fetch_ohlcv_data(
        ticker="AAPL",
        start_date="2024-01-01",
        end_date="2024-06-01",
        interval="1d"
    )
    if aapl_daily is not None:
        print("\nApple Daily Data:")
        print(aapl_daily.head())

    # Example 2: Get 15-minute data for EUR/USD
    eurusd_15m = fetch_ohlcv_data(
        ticker="EURUSD=X",
        start_date="2024-06-01",
        end_date="2024-06-07",
        interval="15m"
    )
    if eurusd_15m is not None:
        print("\nEUR/USD 15-Minute Data:")
        print(eurusd_15m.head())
By wrapping the logic in a function, you've created a modular tool. Now, anytime you need data, you can simply call fetch_ohlcv_data() with the parameters you need. This is a fundamental practice in writing clean and scalable code for your trading bot.
Conclusion
Congratulations! You've successfully written and executed Python scripts to fetch historical market data, a critical skill for your journey into algorithmic trading.
Key Takeaways:
- Libraries like
yfinanceandtvdatafeedprovide easy-to-use interfaces for downloading historical OHLCV data. - The data is typically loaded into a pandas DataFrame, which is the central data structure for analysis in Python.
- You can specify tickers, date ranges, and timeframes (
interval) to get the exact data needed for your analysis. - For your specific interests in ICT,
tvdatafeedis an excellent tool because it sources data from TradingView and has great support for forex and futures. - Encapsulating your code in functions (like
fetch_ohlcv_data) is a key programming practice that makes your code reusable and organized.
Preview for the Next Lesson:
You now have the power to pull data into Python. But what do you do with it? The raw data might have missing values or might not be in the perfect format. In our next lesson, "Load, store, and manipulate time-series data using the pandas library," we will dive into the capabilities of pandas. You'll learn how to inspect your DataFrame, handle missing data, and begin manipulating it to prepare for identifying those high-probability ICT setups.