Hello! Welcome to our next lesson in the "Working with Market Data in Python" module.
In our last session, we covered a lot of ground. You learned how to load data into a pandas DataFrame, the importance of setting a DatetimeIndex, and how to manipulate and even resample your data to different timeframes. These are powerful skills, but they all rely on one important assumption: that your data is perfect.
In the real world, this is rarely the case. Raw market data often comes with imperfections—gaps where data points are missing. These can happen for many reasons: market holidays, data feed interruptions, or simple errors. Today, we'll tackle this head-on. Our goal is to clean and preprocess raw market data to handle missing values.
Mastering this is non-negotiable for building reliable trading strategies. A single missing candle could hide a critical Fair Value Gap (FVG) or order block, completely invalidating your analysis. By the end of this lesson, you'll know how to systematically find and fix these gaps, ensuring your data is robust and trustworthy for the analysis and automation to come.
Why Clean Data is Crucial for Trading
Imagine calculating a 20-period moving average. If one of the candles in that period is missing, the calculation will fail or, worse, produce an incorrect value that silently corrupts your entire analysis. For ICT concepts, the integrity of the price sequence is everything. A missing bar on the 15-minute chart could be the very one that sweeps liquidity before a major reversal. If your code doesn't see it, it can't act on it.
This is why data cleaning, or "preprocessing," is always the first step after acquiring data.
Step 1: Identifying the Gaps
Before we can fix missing data, we need to find it. Pandas gives us several easy ways to do this. A missing value in pandas is typically represented as NaN, which stands for "Not a Number."
Let's start by creating a sample DataFrame with some artificial gaps to simulate real-world data issues.
import pandas as pd
import numpy as np

# Create a sample time range
dates = pd.to_datetime([
    '2023-01-02 09:00', '2023-01-02 10:00', '2023-01-02 11:00',
    '2023-01-02 12:00', '2023-01-02 14:00', '2023-01-02 15:00'
])

# Create a DataFrame with some NaN values
# Notice the 13:00 candle is missing entirely from the index
data = {
    'Open': [100, 102, 103, 101, 104, 105],
    'High': [101, 103, 104.5, 102.5, 106, 105.5],
    'Low': [99.5, 101.5, 102, np.nan, 103, 104], # Missing Low
    'Close': [100.5, 102.5, np.nan, 102, 105, 104.5], # Missing Close
    'Volume': [1000, 1500, 1200, 1800, np.nan, 2000] # Missing Volume
}

df = pd.DataFrame(data, index=dates)

print("Original DataFrame with missing values:")
print(df)
Now, let's find these NaN values programmatically. The .isnull() method returns a DataFrame of the same shape, but with True where data is missing and False otherwise. We can chain this with .sum() to get a count of missing values in each column.
print("\nMissing values per column:")
print(df.isnull().sum())
This simple command immediately tells us we have one missing value in Low, one in Close, and one in Volume.
For a more comprehensive, professional-grade assessment, we can create a reusable function. The following is inspired by practices used in quantitative finance.
Chapter 1: Data Collection and Web Scraping - FrontierML
The article 'Chapter 1: Data Collection and Web Scraping' from FrontierML, while about a broader topic, contains an excellent Python function for data quality assessment. It provides a structured way to check for missing values, data types, and more.
In this resource, find the Python code block defining the function assess_data_quality. You can search for this function name. Study its structure to see how it systematically checks for different data quality issues, especially the 'Missing Values' part. This represents a best-practice approach.
Step 2: Strategies for Handling Missing Values
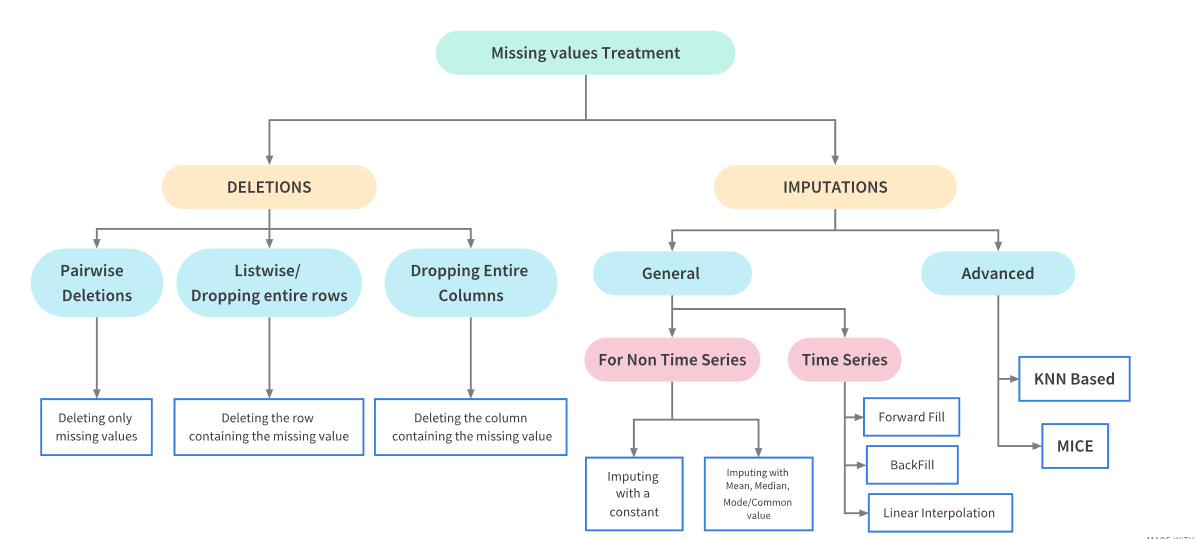
Once you've identified missing values, you have two main choices:
- Deletion: Remove the rows (or columns) that contain missing data.
- Imputation: Fill the gaps with a calculated value.
The best choice depends on the context. This flowchart gives a great overview of the available methods.
Step 3: The Pandas Toolkit for Data Cleaning
The following video from the codebasics channel is an outstanding, step-by-step guide to all the essential pandas functions for handling missing data. We will use it as our primary guide for this section.
Python Pandas Tutorial 5: Handle Missing Data: fillna, dropna, interpolate
The video 'Python Pandas Tutorial 5: Handle Missing Data: fillna, dropna, interpolate' is a comprehensive tutorial that will teach you everything you need to know for this lesson. We'll break it down into key techniques.
Watch the following segments carefully. I recommend having a Jupyter Notebook open to code along. Filling with fillna() (03:55 - 13:01): This is the most versatile method. Pay attention to: Filling all NaNs with a single value (e.g., 0). Using a dictionary to fill different columns with different values. Forward Fill (ffill) and Backward Fill (bfill): This is the most common technique for time-series. Understand how it carries the last (or next) valid observation into the gap. Smarter Filling with interpolate() (13:01 - 16:57): This is a more advanced imputation method. Focus on: How linear interpolation provides a better guess for numerical data than ffill. The power of method='time', which makes the interpolation sensitive to the actual time gap between data points. This is perfect for our use case. Deleting with dropna() (16:57 - 20:04): Learn how to remove rows with missing data. Understand the how='all' and thresh parameters, which give you more control over what gets dropped.
Let's summarize and apply these techniques.
Deletion: dropna()
This method removes rows containing NaN values.
- When to use it: If you have a massive dataset and only a few rows have missing data, dropping them might be acceptable.
- The danger for time-series: Dropping a row creates an artificial gap in time, which can corrupt time-dependent calculations like moving averages or your analysis of price legs. Use with extreme caution.
# Drop any row that has at least one NaN value
df_dropped = df.dropna()
print("\nDataFrame after dropna():")
print(df_dropped)
Notice how three different rows were removed, leaving a fragmented DataFrame.
Imputation: fillna()
This is usually the better approach for financial data.
Forward Fill (ffill): Fills a NaN with the last valid observation. This is like saying, "If I don't know the price now, I'll assume it's the same as the last price I saw."
# Use forward fill to handle NaNs
df_ffill = df.fillna(method='ffill') # or df.ffill()
print("\nDataFrame after forward fill:")
print(df_ffill)
Look at the Low and Close columns. The NaN values have been replaced by the value from the row above.
Imputation: interpolate()
Interpolation makes an educated guess to fill the gap. For a linear interpolation, if the price before the gap was 100 and the price after is 102, it will fill the gap with 101.
# Use linear interpolation
# Note: Interpolation only works on numeric columns.
df_interpolated = df.interpolate()
print("\nDataFrame after linear interpolation:")
print(df_interpolated)
The NaN in the Low column has been filled with 102.5, which is the midpoint between the known values before (102) and after (103). This is often a more realistic estimate than ffill.
Test your understanding!
In our df_ffill example, the missing Volume at 2023-01-02 14:00 was filled with 1800 (the value from the previous candle). Does this make sense for volume data? What might be a more logical value to fill a missing volume entry with, and which fillna technique would you use?
Show answer
Carrying the volume forward often doesn't make logical sense. A period of missing price data likely corresponds to a period of zero trading activity or a data feed issue. Therefore, filling a missing Volume value with 0 is often a more reasonable assumption.
You would do this using: df['Volume'] = df['Volume'].fillna(0)
Alternatively, you could use a dictionary with fillna to apply different rules to different columns in one go:df_filled_smartly = df.fillna({'Low': df['Low'].ffill(), 'Close': df['Close'].ffill(), 'Volume': 0})
Step 4: Handling Structural Gaps (Weekends & Holidays)
Our first example had NaN values within existing rows. But what about the 13:00 candle, which is completely missing? This is a "structural" gap in our time index. This happens frequently with real data over weekends or holidays.
To fix this, we first need to create a complete index and then reindex our DataFrame to match it. This will make the implicit gaps explicit (NaNs), which we can then fill.
Python Pandas Tutorial 5: Handle Missing Data: fillna, dropna, interpolate
Let's revisit the codebasics video for one last, powerful technique. This section shows how to fix a broken time-series index.
Please watch the final segment on inserting missing dates (20:04 - 21:32). Focus on how pd.date_range() is used to create the 'correct' index and how df.reindex() is used to conform the old data to this new, complete index.
Let's apply this to our df. We expect hourly data from 9:00 to 15:00.
# 1. Create the complete, expected index
full_index = pd.date_range(start='2023-01-02 09:00', end='2023-01-02 15:00', freq='H')

# 2. Reindex the DataFrame. This will insert a new row for 13:00 with all NaN values.
df_reindexed = df.reindex(full_index)

print("\nDataFrame after reindexing (notice the new 13:00 row):")
print(df_reindexed)

# 3. Now, we can apply a fill method to the entire reindexed DataFrame
df_complete = df_reindexed.ffill()
# A common practice for OHLC is to ffill, and then fill any remaining NaNs (like in Volume) with 0
df_complete['Volume'] = df_complete['Volume'].fillna(0)


print("\nFinal, complete DataFrame:")
print(df_complete)
Now we have a complete, clean dataset with no gaps. The integrity of our time-series is preserved, and it's ready for analysis.
Conclusion
You've now learned a critical skill in the data science pipeline for algorithmic trading. Raw data is messy, but with the tools in pandas, you can systematically clean it to build a reliable foundation for your strategies.
Key Takeaways:
- Always check for missing data using
.isnull().sum()after loading a new dataset. - Deletion (
dropna) is risky for time-series analysis as it breaks the temporal sequence. - Imputation is the preferred method.
ffill()(forward fill) is a simple and common way to fill price data.interpolate()provides a more intelligent guess, withmethod='time'being especially powerful for financial data.fillna(0)is often suitable for missing volume data.
- For structural gaps (like missing days or hours), use
reindex()with a completedate_rangeto make the gaps explicit, then apply an imputation method.
Preview for the Next Lesson:
With our data now clean and complete, we can finally start performing calculations on it. In the next lesson, "Calculate basic indicators like moving averages using pandas," we will take our first step into quantitative analysis. You'll learn how to compute indicators programmatically, a fundamental building block for defining market trends and developing automated trading rules.