Hello! Welcome to your fourth lesson in the module on "Price Imbalances: The Institutional Footprint."
In our last lesson, we explored how institutions manage their positions by recognizing order block mitigation. We saw that when price returns to a key level, it's often a deliberate action, not a random event. We also noted that the strong institutional moves that create order blocks also leave behind other footprints.
Today, we will focus on one of the most significant of these footprints: the Fair Value Gap (FVG), also known as an imbalance. This is a core concept in ICT that represents a moment of extreme inefficiency in the market. Mastering the ability to identify an FVG is a foundational skill, as these gaps often act as powerful magnets for price. This skill is also the first crucial step toward your goal of eventually automating the detection of ICT patterns.
By the end of this lesson, you will be able to define what a Fair Value Gap is and confidently identify it on a price chart.
1. Defining the Fair Value Gap (FVG)
At its core, a Fair Value Gap is a price inefficiency created when the market moves so quickly and aggressively in one direction that a "fair" two-sided exchange doesn't occur. This leaves behind a pocket of untraded prices.
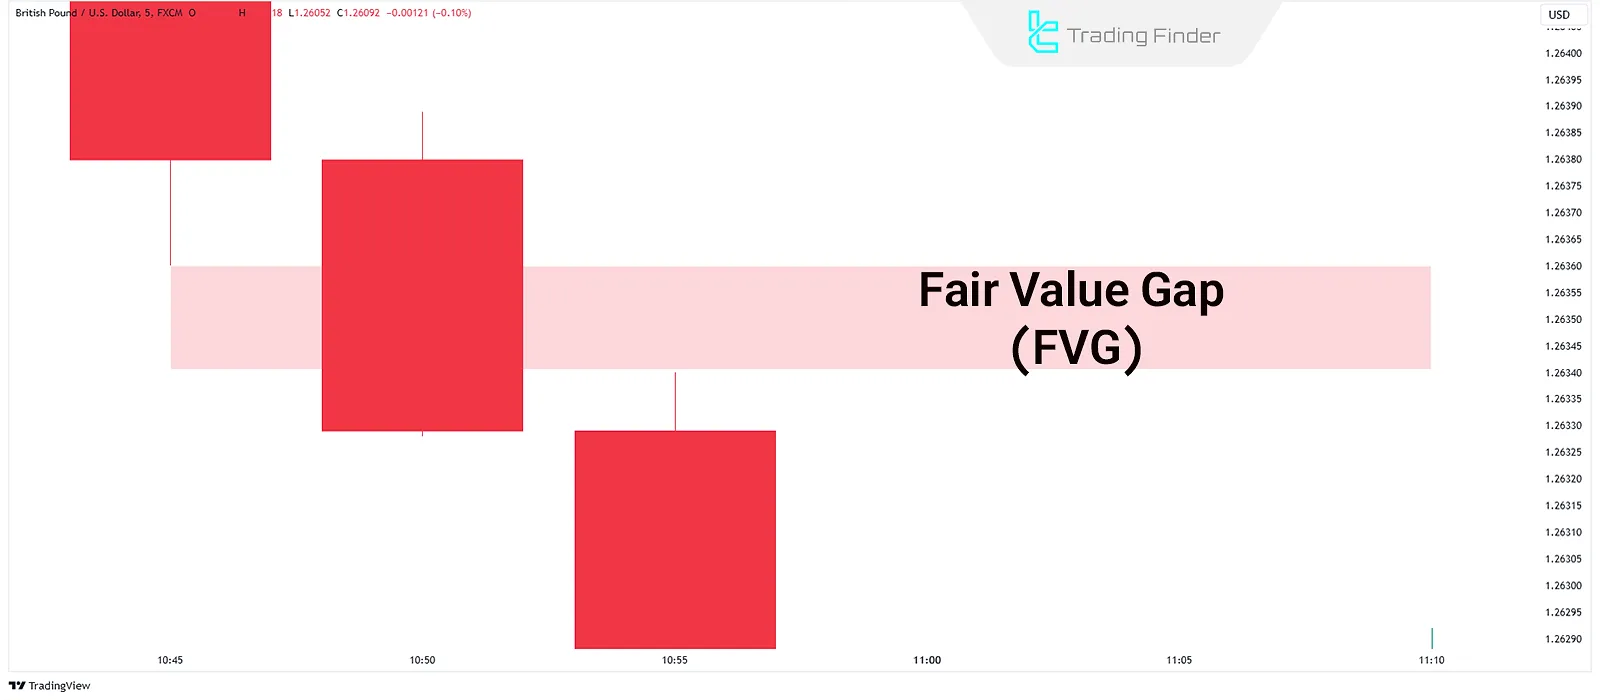
Visually, an FVG is a simple three-candlestick pattern.
- A Bullish FVG is created when the high of the first candle does not overlap with the low of the third candle.
- A Bearish FVG is created when the low of the first candle does not overlap with the high of the third candle.
The space between these two wicks, seen on the middle (second) candle, is the Fair Value Gap.

To see this in action, let's watch a short video that clearly defines and illustrates this three-candle structure.
Understanding Fair Value Gaps (FVG) - ICT Concepts
This video from TTrades provides a concise and clear visual definition of a Fair Value Gap. It will show you exactly what to look for and, just as importantly, what is NOT an FVG.
Watch the segment from 00:19 to 02:48. Focus on the three-candle rule and how the lack of overlap between the first and third candles' wicks creates the gap.
ICT Terminology: BISI and SIBI
Within the ICT framework, you'll often hear specific names for these gaps that describe the imbalance more precisely:
- BISI (Buy-side Imbalance, Sell-side Inefficiency): This is a Bullish FVG. It signifies an aggressive move up where buy-side was offered, but sell-side was inefficiently delivered.
- SIBI (Sell-side Imbalance, Buy-side Inefficiency): This is a Bearish FVG. It signifies an aggressive move down where sell-side was offered, but buy-side was inefficiently delivered.
The video you just watched also introduces these terms. If you'd like a quick refresher on them, you can review the clip from 02:35 to 03:52.
2. The "Why" Behind Fair Value Gaps
Identifying the pattern is the first step, but understanding why it forms is what gives the concept its power. FVGs are not random; they are direct evidence of institutional order flow.
When large institutions execute massive orders, they can move the price so rapidly that it creates a one-sided market. This rapid repricing, often triggered by major economic news or earnings reports, doesn't allow time for the market to facilitate trades at every price level. This creates the imbalance or "inefficiency."
Because markets algorithmically seek efficiency, they have a natural tendency to return to these gaps to "rebalance" price. This means the FVG acts like a magnet, drawing price back to it. This rebalancing allows orders that were initially skipped to be filled.
To deepen your understanding of this market dynamic, let's explore the theory behind FVGs.
Fair Value Gap Simplified - Smart Money Course
This video from Smart Risk explains the institutional logic behind FVGs. It frames them as one of the two primary forces driving the market, alongside liquidity.
Watch from the beginning to 02:52, and then the section from 03:58 to 05:46. Pay attention to how the video describes FVGs as 'institutional footprints' and explains that pending orders left within these gaps act as a 'magnet for price'.
As the video explains, the unfilled orders within the gap create a liquidity pool that the market is drawn to, providing the logic for why price so often revisits these zones.
For a summary of the fundamental drivers, this article provides a good overview.
Fair Value Gap: Explanations, Types, Indicator, Trading ...
The article 'Fair Value Gap' on Strike.money explains the macroeconomic and sentiment-based reasons for FVGs.
Read the section titled 'Why Does a Fair Value Gap Occur?'. Note the connection between FVGs and events like economic news and earnings reports—areas you may be familiar with from your business background.
3. Practical Identification on a Chart
Now let's apply this knowledge to real charts. Your task is to train your eyes to spot the three-candle pattern amidst the noise of price action.
Remember the rules:
- Look for a strong, impulsive candle (the middle candle).
- Check the wick of the candle before it (Candle 1).
- Check the wick of the candle after it (Candle 3).
- If there is a space between them, you have identified an FVG.
Let's watch a final video that walks through identifying multiple FVGs on a chart, including an important exception to the three-candle rule.
Fair Value Gap Simplified - Smart Money Course
The Smart Risk channel provides another excellent walkthrough, this time identifying multiple FVGs in both bullish and bearish scenarios on a real chart. It also introduces a special case for identifying an FVG involving four candles.
First, watch from 02:37 to 03:58 to understand the exception: how to identify an FVG using a four-candle sequence when an 'inside bar' is present. Then, watch the practical example on the EUR/USD chart from 10:04 to 12:40. Observe how the analysis proceeds from top-to-bottom in a bearish market to find the gaps.
This four-candle rule is an important nuance. When the first candle of a potential three-candle sequence is an "inside bar" (its high and low are contained within the previous candle), you must use the previous candle (the "mother bar") as your true Candle 1 to correctly identify the gap.
Test your understanding!
Look at the candlestick chart snippet below. Based on the three-candle rule, is there a Fair Value Gap? If so, is it bullish or bearish, and which three candles form it?
Show answer
Yes, there is a Bullish Fair Value Gap (a BISI).
- Candle 1: The first green candle in the sequence.
- Candle 2: The large, impulsive green candle in the middle.
- Candle 3: The third green candle.
The FVG is the space between the high of Candle 1 and the low of Candle 3. Because the move is upwards and leaves an inefficiency below, it is a bullish FVG.
Conclusion
In this lesson, you've learned to identify one of the most critical components of the ICT methodology. You can now define what a Fair Value Gap is, understand the institutional mechanics that create it, and spot it on a chart.
Key Takeaways:
- A Fair Value Gap (FVG) is an inefficiency created by a rapid price move, identified by a three-candle pattern where the wicks of the first and third candles do not overlap.
- A bullish FVG is called a BISI (Buy-side Imbalance, Sell-side Inefficiency).
- A bearish FVG is called a SIBI (Sell-side Imbalance, Buy-side Inefficiency).
- FVGs represent the footprints of institutional order flow and act as magnets for price because the market seeks to rebalance these inefficient areas.
- Identifying FVGs is a non-negotiable first step for using them in a trading strategy and, eventually, for programming a trading bot.
Preview for the Next Lesson:
Now that you can identify FVGs, the next logical step is to learn how to use them. In our next lesson, we will focus on "Use FVGs as high-probability areas for trade entries or targets." We will explore how price interacts with these zones and how you can frame a trade setup around them.