Hello! Welcome to the next lesson in our journey to master ICT trading.
In the last few lessons, you've assembled the core components of a daily trading plan. You know how to establish a daily bias to determine where price is likely headed, and you can identify ICT Killzones to know when the market is most active.
Today, we will connect these two powerful concepts. The goal of this lesson is to learn how to anticipate the high-probability session for a setup based on the daily bias. In other words, you'll learn how to analyze the market's early behavior to decide whether the main trading opportunity is more likely to unfold during the London session or the New York session. This will allow you to focus your energy on the most promising window of opportunity each day.
1. The Daily Narrative: Power of 3 Across Sessions
The most fundamental template for a trading day follows the Power of 3 (AMD) concept, which you'll recall is Accumulation, Manipulation, and Distribution. We can map this directly onto the daily sessions.
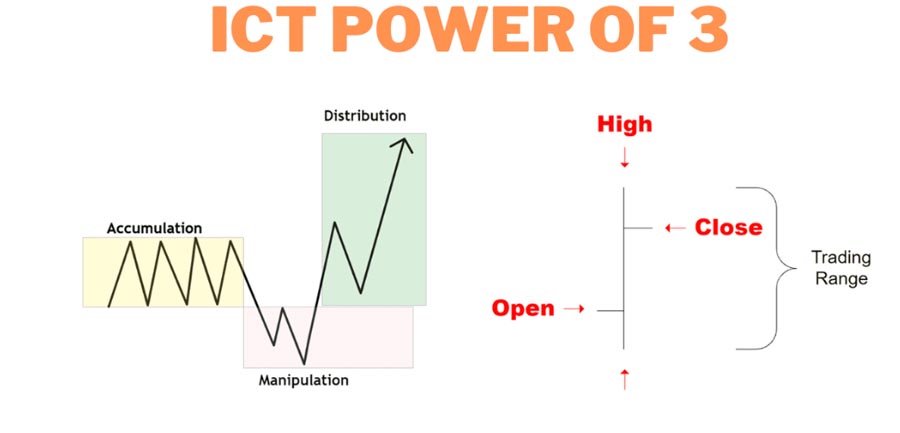
As the article "Top 5 ICT Trading Strategies" explains, a common daily script is:
- Accumulation: The Asian session often consolidates, building liquidity above its high and below its low.
- Manipulation: The London session frequently stages a "Judas Swing"—a false move that sweeps liquidity from one side of the Asian range.
- Distribution: The New York session then typically delivers the true expansion move for the day, often in the direction opposite to the London manipulation.
This AMD framework gives us our baseline expectation. A sweep of the Asian range low during London often sets the stage for a bullish New York session, and vice-versa.
How To Identify Daily Bias Using ICT Concepts
The article 'How To Identify Daily Bias Using ICT Concepts' by City Traders Imperium provides a clear rule for interpreting the Asian session.
Please read the subsection titled '4. Observe the Asian Session Range for Manipulation'. It's short but contains a crucial rule that forms the basis for anticipating the day's direction.
This rule is your first and most important clue. The manipulation of the Asian range during the London Killzone is often the event that defines the daily bias and signals which session will likely offer the main move.
2. A Systematic Approach: Analyzing Session Profiles
While the AMD template is a great guide, price action can be more nuanced. A powerful way to anticipate the next session's move is to classify what the previous session did.
We can categorize the previous session's price action into one of three profiles. Understanding which profile just occurred allows you to forecast what is most likely to happen next.
How To Find Daily Bias (Step By Step)
The video 'How To Find Daily Bias (Step By Step)' by TJR offers an outstanding framework for this. He breaks down how to anticipate the New York session by analyzing what London did.
Watch from 02:42 to 10:52. The presenter details three distinct session profiles and explains how to use them. Focus on understanding: Previous Session Consolidation -> New Session Manipulation/Reversal Previous Session Manipulation -> New Session Reversal Previous Session Manipulation + Reversal -> New Session Continuation Pay close attention to how he combines these profiles with identifying high-timeframe draws on liquidity.
Let's summarize this powerful framework:
| If the London Session... | Then We Anticipate the New York Session will... |
|---|---|
| Consolidated (no clear sweep of a major high/low) | Begin with a manipulation of a key level, then reverse. |
| Manipulated a key high/low but did not reverse | Provide the reversal away from that manipulation. |
| Manipulated AND Reversed (e.g., swept Asian low and moved up) | Continue the trend established in London. |
This gives you a logical, repeatable process for building a narrative as the day unfolds. You are no longer guessing; you are reacting to what the market has shown you.
3. Case Study: Putting the Session Profiles into Practice
Let's see how this works with a real chart example. The same video provides an excellent walkthrough.
How To Find Daily Bias (Step By Step)
Let's continue with the TJR video to see these profiles in action.
Watch the analysis of Thursday's price action from 15:01 to 16:42. Notice how the presenter first identifies what London did (manipulated Asian lows and reversed) to anticipate a New York continuation.
This example perfectly illustrates Profile #3 (Manipulation + Reversal -> Continuation). By observing that London already did the "heavy lifting" of the manipulation, the trader can confidently anticipate that New York's job is to continue the established upward move.
One crucial nuance: even in a continuation profile, the New York session will almost always have its own smaller, lower-timeframe manipulation at the open. It needs to engineer liquidity to fuel the continuation move.
How To Find Daily Bias (Step By Step)
This final clip from the TJR video clarifies this essential point about manipulation in continuation moves.
Watch from 21:26 to 25:15. This is a vital section. The presenter explains that in a continuation scenario, you should not look for a major reversal but instead for a small retracement or sweep of a 5-minute or 15-minute low/high at the NY open. This creates the entry opportunity to join the larger trend.
4. The "Next Day Model": Using Daily Candles for Clues
Another way to anticipate the day's move is by looking at the previous day's candle. This technique, which complements the session-by-session analysis, is often called the "Next Day Model."
ICT Daily Bias - The Only Video You Will Ever Need!
The video 'ICT Daily Bias - The Only Video You Will Ever Need!' by TTrades explains this concept clearly.
Please watch from 07:21 to 09:40. Focus on the concept of 'failure to displace.' When price sweeps a swing low but closes back inside the range (fails to close below it), you can anticipate a bullish move the next day. The opposite is true for a sweep of a swing high.
This model provides an excellent top-down bias before the day even begins. If the previous day swept a low and closed bullishly, you can go into the Asian and London sessions already anticipating a bullish day, looking for a session profile that confirms this idea.
Let's see this model applied to find a trade in the New York session.
ICT Daily Bias - The Only Video You Will Ever Need!
Continuing with the TTrades video, let's watch an example of this model being applied.
Watch the New York session trade example from 16:11 to 18:03. The presenter uses the fact that the previous day swept a high and closed back in the range (a bearish signal) to frame a short trade during the New York Killzone.
Test your understanding!
It's Wednesday morning. Your daily bias, based on the weekly chart, is bullish.
Looking at Tuesday's price action:
- The Asian session was a tight consolidation.
- The London session swept the Asian session low, then reversed and closed with a strong displacement higher, breaking the Asian high.
- The New York session continued this upward move, closing near the high of the day.
What session profile did London and New York exhibit on Tuesday? Based on this, which session (London or New York) might you anticipate offering the primary move on Wednesday?
Show answer
On Tuesday, the market followed the classic "Manipulation + Reversal -> Continuation" profile. London manipulated the Asian low and reversed (M+R), and New York continued that move (C).
Because Tuesday's move was a strong expansion day, it's possible that Wednesday might be a consolidation or retracement day. However, given the bullish daily bias, a high-probability scenario to anticipate would be a retracement during the London session back down into a discount array (like an FVG or order block created during Tuesday's move), followed by a bullish expansion during the New York session.
Therefore, you might anticipate the New York session as being the higher-probability session for a trade on Wednesday, using the London session to set up the entry condition.
Conclusion
You now have a robust, systematic framework for anticipating which trading session is most likely to offer a high-probability setup. By analyzing the market's narrative from session to session, you can align your efforts with the market's intended move.
Key Takeaways:
- The Daily Script: The trading day often follows an AMD narrative: Asia accumulates, London manipulates, and New York distributes.
- Session Profiles are Key: By classifying the previous session's action (Consolidation, Manipulation, or M+R), you can logically forecast the next session's behavior.
- Anticipate the High-Probability Session: If London completes the manipulation and reversal, New York is often the high-probability session for a continuation trade. If London consolidates, the manipulation might occur in New York.
- The Next Day Model: A failure of the previous day's candle to close above/below a swept high/low provides a strong clue for the next day's directional bias.
Preview for the Next Lesson:
With the ability to anticipate both the direction and the session, we will now zoom in to the finest level of detail. Your next lesson is on Candle Range Theory (CRT). We will explore how to analyze the price delivery within a single candle's range to precisely refine your entries and targets—a concept you were particularly interested in exploring.