Hello! Welcome back to our module on Advanced ICT Trade Models.
In our last lesson, you learned how to use SMT divergence as a powerful confirmation signal to enter trades against the apparent trend. We saw that when one correlated asset fails to confirm a new high or low made by another, it's a strong clue that a reversal is imminent.
Today, we're going to place that concept into a larger, more structured context. The learning outcome is to identify the stages of the Market Maker Buy Model (MMBM). You'll learn to recognize a specific, repeatable price pattern that smart money uses to accumulate long positions before engineering a significant upward move. Think of the SMT divergence you just mastered as a critical ingredient that often marks the turning point within this larger model.
1. The Logic Behind the Model: Engineering Liquidity
Before we break down the stages, it's essential to understand why the MMBM pattern forms. It's not a random sequence of price swings; it's a deliberate process by institutional players to engineer liquidity.
During the initial phase of the model, price is driven down in a way that encourages retail traders to sell. As these traders enter short positions, they place their stop-loss orders (which are buy orders) above recent swing highs. This process creates a large pool of buy-side liquidity (BSL). The Market Maker Model is the process by which smart money accumulates positions at low prices and then drives the market up to trigger those buy-stops, allowing them to exit their positions at a profit.
This first video explains this core concept of engineering liquidity.
ICT Market Maker Model - Explained In-depth!
The video 'ICT Market Maker Model - Explained In-depth!' by DanDowdTrading clearly explains the logic behind the sell-side of the curve and how it's designed to build up liquidity for smart money.
Please watch from 01:52 to 04:31. Focus on understanding the purpose of the downward price movement: to create a series of lower highs that entice retail traders to place buy-stops, which serve as exit liquidity for smart money later.
2. The Anatomy of a Market Maker Buy Model (MMBM)
Now, let's break down the MMBM into its distinct, identifiable stages. This model provides a roadmap for a complete price cycle, from consolidation to a major trend reversal and expansion.
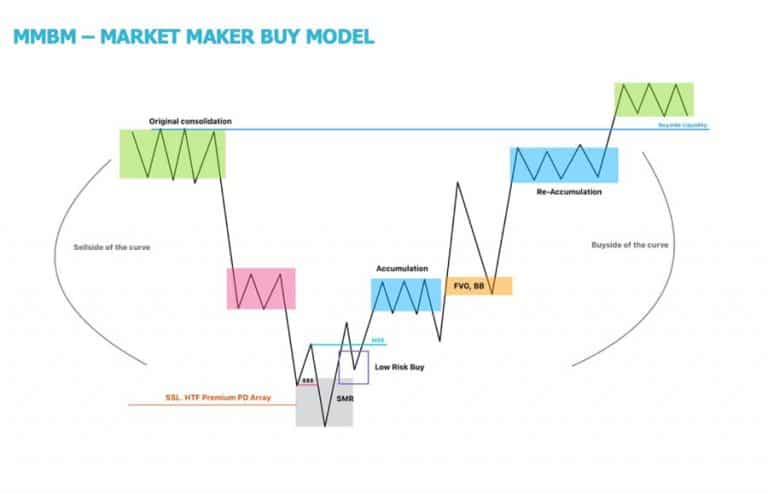
The Stages:
-
Original Consolidation: The model begins with a period of price consolidation or ranging. Liquidity is building above the range highs and below the range lows.
-
The Sell-Side of the Curve: Price breaks out of the consolidation to the downside. It begins creating a series of lower highs and lower lows. This is the liquidity engineering phase we just discussed. In some terminologies, this is also called the distribution phase.
-
The Smart Money Reversal (SMR): This is the crucial turning point at the bottom of the model. It's not just a single point, but a sequence of events:
- Price raids a significant pool of sell-side liquidity (SSL), often by running a key low on a higher timeframe (e.g., a previous day's or week's low).
- This is where you'll often spot a bullish SMT divergence between correlated assets, confirming that the move down is a stop hunt, not a true breakdown.
- The reversal is confirmed when price moves up with displacement, creating a Market Structure Shift (MSS) or Change of Character (ChoCH). This strong upward move typically leaves behind a Fair Value Gap (FVG).
-
The Buy-Side of the Curve: After the SMR, price enters an expansionary phase to the upside. This phase also has sub-stages that offer potential entry opportunities:
- Low-Risk Buy: The first opportunity comes when price retraces into the FVG created during the SMR.
- First Stage of Accumulation: After the initial impulse up, price will make another retracement, often to a new FVG or bullish order block, offering a second entry.
- Re-accumulation: As the trend continues, further retracements create more accumulation opportunities before the final target is reached. One of the key ICT setups you were interested in, the Silver Bullet, often appears in this re-accumulation phase.
-
Targeting Liquidity: The ultimate objective of the MMBM is to run the buy-side liquidity that was engineered on the way down. The primary target is the high of the Original Consolidation.
The following video provides an excellent summary of all these stages in sequence.
ICT Market Maker Model - Explained In-depth!
Let's return to the DanDowdTrading video. It provides a concise walkthrough of all the stages, from the SMR and low-risk buy to the accumulation phases.
Watch from 04:31 to 10:49. This is a crucial segment that ties everything together. 04:31 - 05:18: See how the Smart Money Reversal is defined as an MSS with an FVG. 05:18 - 07:00: Notice the explicit mention of using SMT divergence as confirmation at the reversal point. This directly builds on our last lesson. 07:00 - 09:58: Pay close attention to how he identifies the 'Low-Risk Buy,' 'First Leg of Accumulation,' and 'Reaccumulation' phases. 09:58 - 10:49: The video offers a final recap of the entire model's logic.
3. Seeing the MMBM on a Real Chart
Recognizing these stages on a clean schematic is one thing; spotting them in the chaos of a live chart is the real skill. Let's look at a practical application to see how the theoretical model translates to reality.
ICT Market Maker Model - Explained In-depth!
Now, let's watch the live chart example from the same video. This will help you transition from theory to practical identification.
Watch from 12:18 to 16:43. Try to pause the video at different points and identify the stages yourself before the narrator points them out. Look for the original consolidation, the sell-side curve, the raid on daily sell-side liquidity, the SMR with an FVG, and the subsequent accumulation phases.
4. Consolidating the Concepts
To reinforce your understanding, let's review a textual resource that provides a clear, concise summary of the MMBM components. This will be a useful reference for you to come back to.
Market Maker Buy Model (MMBM) – ICT Trading Model
The article 'Market Maker Buy Model (MMBM) – ICT Trading Model' from writofinance.com offers a great summary. We'll focus on the section that defines the key components.
Please read the section titled 'Major Components of ICT MMBM'. This section clearly defines the four key phases: Ranging Market (Original Consolidation), Engineering Liquidity (Sell-Side Curve), Smart Money Reversal, and Liquidity Hunt (Targeting BSL).
Test your understanding!
Below is a description of price action on a 15-minute chart. Based on what you've learned, try to label which stage of the MMBM each point corresponds to.
- Price is in a tight range for several hours.
- Price breaks the range low and trends down for the next part of the session, creating several new swing highs as it goes.
- Price takes out the previous day's low, then immediately and aggressively reverses, breaking above the last swing high from the downtrend. A bullish SMT divergence is noted against a correlated asset at this low.
- Price continues higher, eventually taking out the high of the range from point #1.
Show answer
- Original Consolidation: The initial range-bound activity.
- The Sell-Side of the Curve (Engineering Liquidity): The engineered downtrend creating buy-stops above the new swing highs.
- The Smart Money Reversal (SMR): The raid on a major low (previous day's low), confirmed by the SMT and the subsequent Market Structure Shift.
- Targeting Liquidity (Liquidity Hunt): The model completes by taking out the buy-side liquidity resting above the original consolidation.
Conclusion
You have now learned to deconstruct one of ICT's most comprehensive trading models. By understanding the MMBM, you can move beyond looking for individual signals like FVGs or order blocks and start reading the broader narrative of the market. You can anticipate where price is likely to go by understanding what liquidity it has engineered and where its ultimate target lies.
Key Takeaways:
- The MMBM is a price template that illustrates how smart money accumulates long positions and engineers liquidity.
- The key stages are: Original Consolidation, the Sell-Side Curve (to engineer BSL), the Smart Money Reversal (often confirmed by SMT and an MSS), the Buy-Side Curve (with low-risk buy and accumulation phases), and the final Liquidity Hunt.
- The model is fractal, meaning it can appear on any timeframe, from monthly charts down to 1-minute charts.
- Being able to identify the current stage of an MMBM gives you a powerful directional bias.
Preview for the Next Lesson:
Now that you can identify the stages of the MMBM, the next logical step is to learn how to trade it effectively. In our next lesson, we will formulate a trade plan for executing a trade based on the MMBM. We will define precise rules for entry, stop-loss placement, and profit targets for the various opportunities that arise within the model. We will also briefly introduce the inverse pattern: the Market Maker Sell Model (MMSM).