Welcome to your next lesson. In our previous session, we established a rigorous method for comparing performance results, using confidence intervals to determine if a change is statistically and practically significant. That entire process, however, rested on a crucial assumption: that the latency numbers you're analyzing are an accurate reflection of reality.
Today, we will challenge that assumption by exploring a subtle but devastating measurement flaw known as coordinated omission. You will learn what it is, how it systematically hides the worst-case performance of your system, and how to detect it. Mastering this concept is a significant step towards senior-level performance analysis, as it demonstrates a deep understanding of measurement theory that goes far beyond simply reading numbers from a dashboard. For a performance engineer using tools like JMeter, being aware of this pitfall is non-negotiable.
The Lie: Service Time vs. Response Time
At the heart of coordinated omission is the difference between what a system does and what a user experiences. Let's start with a simple analogy of a customer placing an order through a call center.
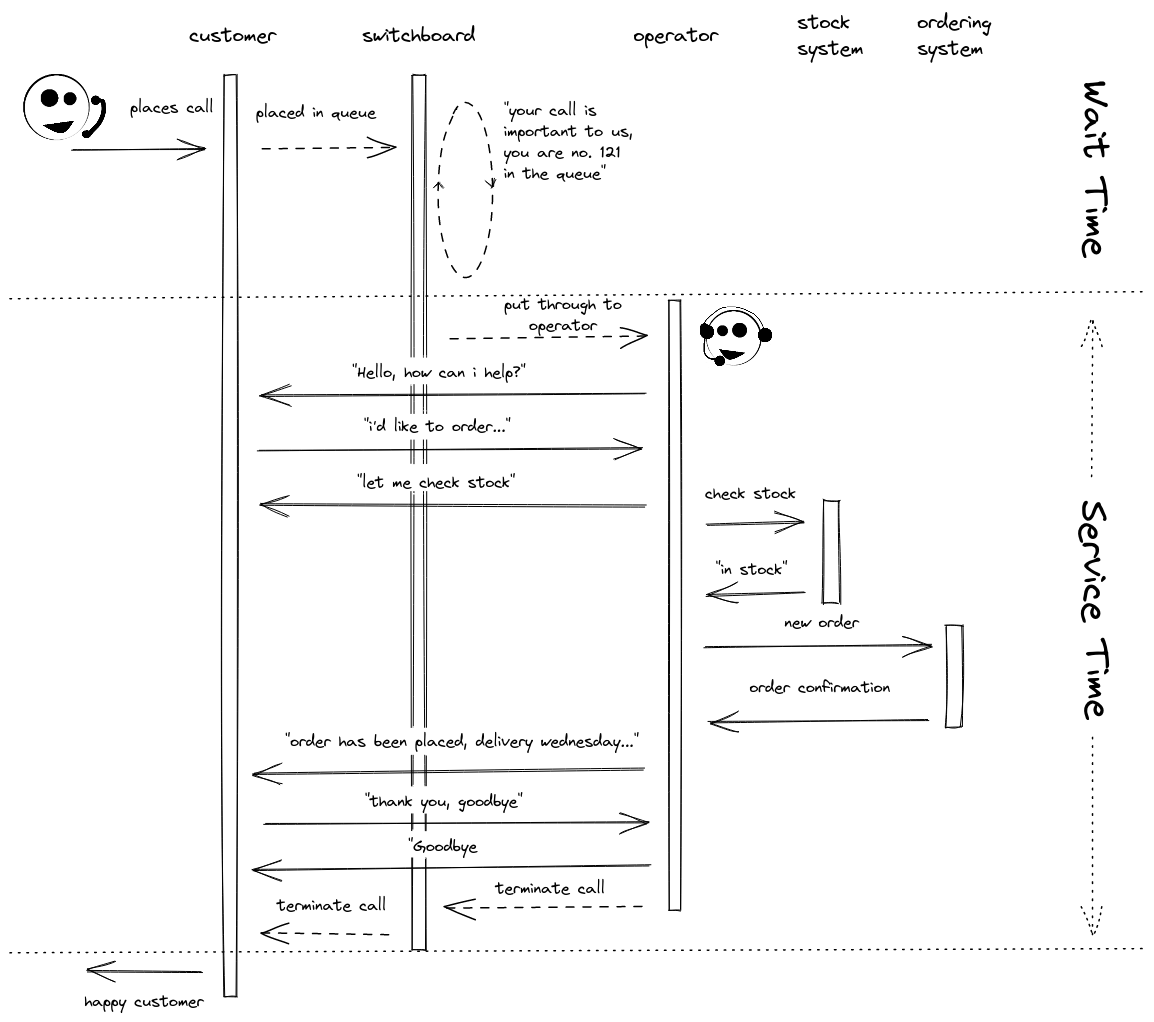
As the diagram shows, the total time the customer is on the phone—the response time—is the sum of their time waiting in the queue and the time it takes the operator to actually handle their request.
- Service Time: The duration of the actual work. For the call center, this is when the operator is actively talking to the customer and placing the order.
- Wait Time: The time spent in a queue before service begins.
- Response Time: The total time experienced by the user, which is
Wait Time + Service Time.
Your users, whether they are humans or other microservices, experience response time. The problem is that many simple measurement tools only record service time, completely ignoring the wait time. Coordinated omission is the name for this phenomenon, where the measurement tool "coordinates" with the system under test by pausing during system-wide delays, thereby "omitting" the queueing time from the results.
How Naive Measurement Creates Coordinated Omission
Think about the simplest possible load-testing loop, which you might have seen or even written. It often looks like this, either in a JMeter thread or a simple script:
- Record the start time (
t_start). - Send a request and wait for it to complete.
- Record the end time (
t_end). - Calculate and log the latency (
t_end - t_start). - Go back to step 1.
This is often called a "closed-loop" test. Now, what happens if your system has a momentary stall—perhaps a long Garbage Collection (GC) pause in the JVM, a network hiccup, or a database lock?
Let's say your service normally responds in 10ms, but a GC pause freezes it for 1 full second.
- The single request that was "in-flight" when the pause began will eventually complete with a reported latency of around 1 second.
- Crucially, during that 1-second pause, your load generator did nothing. It was stuck on step 2, waiting for the response. It didn't send any new requests.
- Once the system unfreezes, the load generator gets its response, logs the 1-second latency, and immediately sends the next request, which completes in the usual 10ms.
The tool only recorded one slow request. In reality, if your system was supposed to handle 100 requests per second (RPS), about 100 requests should have been sent during that 1-second pause. All 100 of those potential users would have experienced a 1-second delay. Your tool, however, makes it look like only one user was affected. It has omitted the impact on the other 99.
This is coordinated omission. The load generator, by waiting for a response before sending the next request, inadvertently hides the true impact of system stalls.
The person who coined this term and has done the most to publicize the issue is Gil Tene. His talks are foundational for any serious performance engineer.
"How NOT to Measure Latency" by Gil Tene
In this segment from his classic talk, "How NOT to Measure Latency," Gil Tene explains the core problem. Pay close attention to the hypothetical system example he uses—it's a brilliantly clear way to understand the magnitude of the distortion.
First, watch the section where he defines the problem and how load generators accidentally conspire with the system under test, starting around his explanation. Then, focus on the hypothetical system example. He describes a system that is perfect for 100 seconds and then stalls for 100 seconds. Note the immense difference between the real user-experienced percentiles and what a naive tool would report.
The Devastating Impact on Your Metrics
As you just saw, the effect of coordinated omission isn't a minor rounding error. It can understate your tail latency (p99, p99.9, etc.) by orders of magnitude.
This article provides an excellent written summary and a practical Python example that quantifies the distortion.
Coordinated Omission and Why Your P99 Latency Is Probably a Lie
This post by Nikhil Padala provides a crisp explanation, Python code examples, and a powerful table showing the real-world impact.
Read the first three sections of the article. Start with The Naive Benchmark Loop to see how the common serial request pattern causes the problem. Continue through the definition which crisply distinguishes service time from response time distributions. Finally, study the table comparing "Naive" vs. "Corrected" results. The 40x difference in the P99 is the key takeaway here.
The most dangerous consequence of this distortion is that it can lead you to make completely wrong decisions. An "improvement" that reduces the duration of a system stall but makes normal requests slightly slower can actually look like a major regression in your (incorrectly measured) high-percentile latencies. The following article explains this paradox perfectly.
coordinated omission – Brave New Geek
This article from the "Brave New Geek" blog gives another walkthrough of the system stall scenario and highlights the paradoxical effect on measurements.
Please read the section titled A Coordinated Conspiracy. Focus on the final paragraphs, where the author shows how improving a system (replacing a 100-second pause with a consistent 5ms response time) makes the reported p99.99 latency appear to get 5x worse.
This is why understanding coordinated omission is so vital. If your measurement foundation is broken, any conclusions you build on top of it are worthless.
How to Detect Coordinated Omission
Given that many tools, including JMeter when used naively, can suffer from this, how can you detect if your results are being skewed?
-
The "Vertical Wall" Percentile Plot: This is the most telling visual clue. When you plot your full latency percentile distribution, a graph suffering from coordinated omission often shows a flat line for the majority of percentiles, followed by a sudden, near-vertical jump at the highest percentiles. This vertical line is where the tool is hiding a huge amount of wait time.
-
The "CTRL+Z" Test: This is a simple, practical test you can run. While your load test is running against a server on a Linux machine, manually pause the server process for a few seconds (e.g.,
kill -STOP <pid>or by hittingCTRL+Zin its terminal) and then resume it (kill -CONT <pid>orfg). If your load generator's report shows mostly perfect latencies with maybe one or two huge outliers, and the throughput dropped to zero during the pause, it is suffering from coordinated omission. A corrected tool would show a large number of requests all having a high latency corresponding to the pause duration. -
Log Gap Analysis: Examine the raw logs from your load generator. If you see a large gap in time where no requests are being initiated, followed by a single entry with a very high latency, you have likely found an instance of coordinated omission.
The Solution: Measuring Against Intended Send Time
The fix for coordinated omission is conceptually simple: instead of measuring latency from when a request was actually sent, you must measure it from when the request was intended to be sent.
Corrected Latency = Response Received Time - Intended Request Send Time
This approach correctly accounts for any time the request spent waiting in a queue (either on the client or server side) because the measurement clock started ticking at the scheduled time, regardless of system stalls.
The article "Coordinated Omission and Why Your P99 Latency Is Probably a Lie" that you read earlier provides a clear Python implementation of this principle.
Coordinated Omission and Why Your P99 Latency Is Probably a Lie
Let's revisit the same article to look at the solution.
Focus on the section Measuring This Correctly. Study the Python code in the correct_benchmark function. The most important line is latency_ns = end_ns - intended_start_ns. Make sure you understand why this captures the queuing delay.
Tools designed for high-fidelity latency measurement, such as HdrHistogram, have this correction mechanism built-in. Modern load generators like wrk2 and k6 are also aware of this problem and provide options to maintain a constant arrival rate, which avoids the issue. When using tools like JMeter, you must be more careful, often relying on plugins or specific configurations (like the Throughput Shaping Timer) to ensure you are generating load independent of the system's response time.
Conclusion
You've now uncovered one of the most common and misleading traps in performance measurement. Believing naively measured latency statistics is a mistake many engineers make; knowing how to spot and correct for coordinated omission sets you apart and is a hallmark of a senior practitioner.
Key Takeaways:
- Coordinated omission occurs when measurement tools pause during system stalls, measuring service time instead of the full user-experienced response time.
- This flaw causes a dramatic under-reporting of tail latencies (p99, p99.9), making a system appear much faster and more consistent than it actually is.
- The data can be so distorted that genuine system improvements can appear as performance regressions.
- You can detect coordinated omission by looking for "vertical walls" in percentile plots or by performing a "CTRL+Z" test.
- The solution is to measure latency from the intended request start time, not the actual start time, thereby including any queueing or wait time in the result.
In our last few lessons, we have learned how to isolate steady-state data, compare it rigorously, and now, ensure it's not distorted by measurement artifacts. With this solid foundation in measurement, our next lesson will focus on defining what to measure: we will explore how to create measurable Service Level Indicators (SLIs) and Service Level Objectives (SLOs) for a user journey.