Welcome to the final lesson in our module on Performance Measurement and Statistical Reasoning. Over the past few lessons, we've built a solid foundation. We've learned how to isolate meaningful data from test runs, use statistics to determine if a change is significant, and, most recently, how to spot and correct for the dangerous measurement flaw of coordinated omission. In essence, you've mastered the principles of how to measure correctly.
Today, we shift our focus from the how to the what. What should we be measuring, and how do we define what "good" performance actually looks like? This lesson introduces the concepts of Service Level Indicators (SLIs) and Service Level Objectives (SLOs)—the professional's toolkit for translating ambiguous user feelings like "the app is slow" into concrete, measurable engineering targets. For a senior performance engineer, defining and defending these objectives is a core responsibility that bridges the gap between technical work and business value.
From User Happiness to Engineering Metrics
The ultimate goal of performance engineering isn't to chase ever-smaller latency numbers; it's to ensure users can achieve their goals with the system efficiently and without frustration. This user-centric perspective is the starting point for defining meaningful performance targets. The first step is to identify the critical "user journeys."
A user journey is a sequence of steps a user takes to accomplish a specific goal. For an e-commerce site, a critical journey might be "search for a product, add it to the cart, and complete checkout." For the kind of SaaS application you work with, it might be "log in, navigate to a project dashboard, and generate a quarterly performance report."
By focusing on these journeys, we ground our performance work in activities that directly impact the user experience and the business's success.
The entire process of moving from a high-level business objective to a functional system with measurable reliability targets can be visualized in a framework called the Service Level Objective Development Life Cycle (SLODLC).
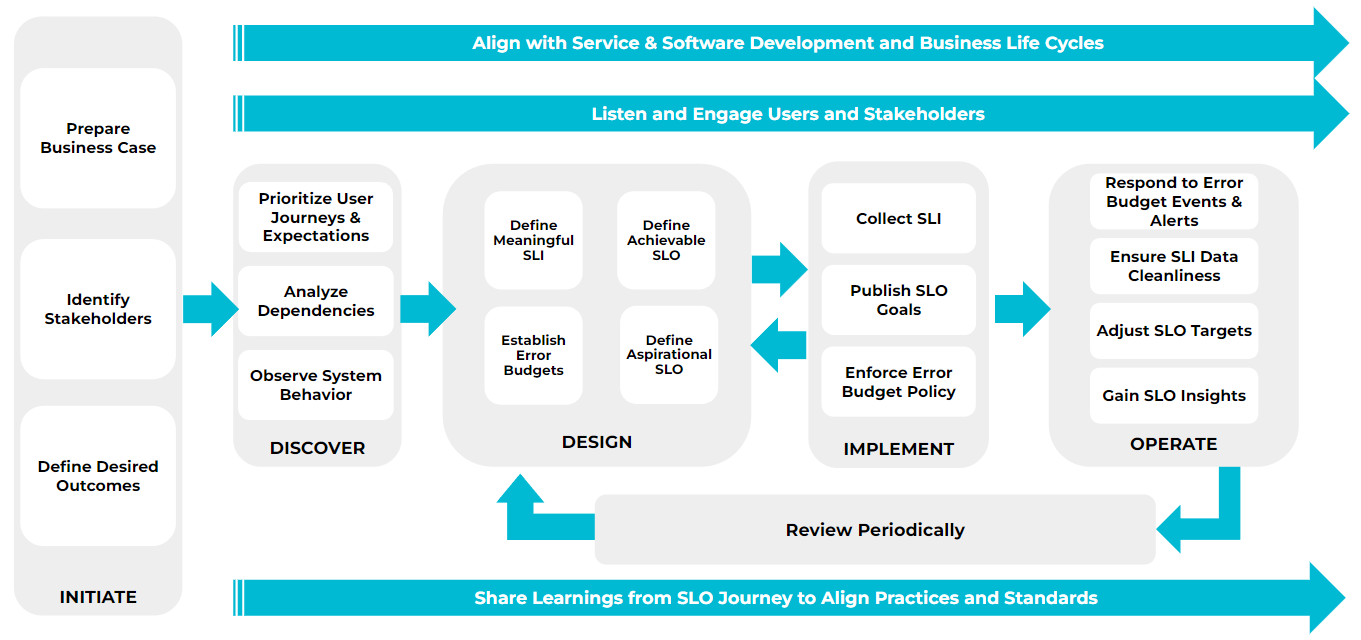
As you can see, the process begins by identifying stakeholders and desired outcomes, then moves into discovering user journeys. This is exactly where we will start.
The Language of Reliability: SLI, SLO, and SLA
Once we have a user journey, we need a precise language to describe its performance. This is where three related acronyms come into play: SLI, SLO, and SLA. It is critical to understand the distinction between them.
What is a Service Level Objective (SLOs) and what it means for performance testing
This article from the Gatling blog provides exceptionally clear definitions for these core concepts. Please read the section "SLO vs SLI vs SLA".
Focus on the table and the definitions that follow it. Read from this section to internalize the specific role of each term. The key is to see them as a hierarchy of measurement, internal goals, and external promises.
To summarize the key points from the reading:
- Service Level Indicator (SLI): The raw measurement. It is a quantitative measure of some aspect of your service. Think of it as the reading on your system's speedometer. Examples: request latency, error rate, system throughput.
- Service Level Objective (SLO): The internal target. This is the goal you set for your SLI over a specific period. It defines your "speed limit." Example: 99.9% of requests should have a latency under 500ms over 30 days.
- Service Level Agreement (SLA): The external contract. This is a promise you make to your customers, which often carries financial penalties if breached. Your internal SLOs should be tighter than your SLAs to ensure you can correct course long before you violate a contract.
As performance engineers, our primary focus is on defining and validating SLIs and SLOs.
Defining a Service Level Indicator (SLI)
An SLI isn't just any metric. A well-formed SLI is typically expressed as a ratio: the proportion of good events to the total number of valid events.
SLI = (Good Events / Valid Events) * 100%
This structure is powerful because it normalizes the measurement and provides a clear indicator of quality. Let's hear this explained by an expert from Google.
How to get started with SLI/SLO with Steve McGhee
In this clip from the "Is it Observable" channel, the host explains the fundamental structure of an SLI.
Watch the segment from the definition of SLI. The key insight is that an SLI is a ratio of two numbers: good events divided by total events.
The most common SLIs for performance and reliability fall into a few key categories:
- Availability (or Correctness): Measures whether the service is working as expected.
- Good Events: Requests that return a successful response (e.g., HTTP 2xx).
- Valid Events: All legitimate requests (often excluding client errors like HTTP 4xx, which are not the system's fault).
- Example SLI: The proportion of non-4xx requests that return a 2xx or 3xx status code.
- Latency (or Speed): Measures how fast the service is. This is where your expertise in latency percentiles comes in.
- Good Events: Requests that complete faster than a certain threshold (e.g., under 500ms).
- Valid Events: All legitimate, successful requests.
- Example SLI: The proportion of successful requests that complete in under 500ms.
This video provides a great overview of the main SLI categories and the logic behind defining them.
Service Level Objectives (SLOs) - noob to pro in under 30 minutes!
The video "Service Level Objectives (SLOs) - noob to pro" gives clear examples of SLI types and discusses the implementation details.
First, watch the section from the four categories of SLIs: Latency, Availability, Consistency, and Throughput. Then, watch the next section on implementation from planning and measurement, which discusses how to source SLI data from logs and the importance of distinguishing different error types.
The distinction between user errors (like bad input, leading to a 400 error) and server errors (500 errors) is vital. Including user errors in your "valid events" denominator would unfairly penalize your service's availability metric for something it cannot control.
Setting a Service Level Objective (SLO)
Once you have a well-defined SLI, the next step is to set a target for it. This target is the SLO. A complete SLO has three components:
- An SLI: The metric you are measuring.
- A Target: The percentage of events that must be "good".
- A Time Window: The period over which the measurement is evaluated.
A classic SLO looks like this:
[Latency SLI] > [99.9%] over a [rolling 28-day window]
This translates to: "99.9% of successful requests must complete in under 500ms, measured over a rolling 28-day period."
The time window is crucial. We don't typically set SLOs for five-minute intervals. A longer window, like 14 or 28 days, smooths out short-term incidents and better reflects the user's overall experience with the service over time. It aligns the measurement cadence with business and development cycles (like sprints).
How to get started with SLI/SLO with Steve McGhee
Let's return to the "Is it Observable" video, where Steve McGhee explains the reasoning behind choosing longer time windows for SLOs.
Watch the segment from the discussion on time windows. Pay attention to the rationale for using 14- or 28-day windows to align with business speed and the impact of engineering changes.
A Framework for Defining SLOs
Now, let's put this all together into a practical, step-by-step process for a single user journey. The UK Government Digital Service (GDS) provides a simple and effective workshop format for this.
Run a Service Level Indicator (SLI) workshop - The GDS Way
This document outlines a 7-step process for a team to define its SLIs.
Read through the seven steps listed at the beginning of the article, from the list of steps. This gives you a high-level map of the process.
This whole process is captured beautifully in the following framework diagram, which uses "submitting a blog post" as its example user journey.

Let's walk through this using a more relevant example for your SaaS environment.
Worked Example: "Generate Report" User Journey
Imagine a critical user journey in your application is for a user to generate a complex data report.
Step 1: Identify the User Journey
- Journey: A user logs in, navigates to the reporting section, selects parameters (e.g., date range, data source), and clicks "Generate Report." The system processes the data and makes a PDF or CSV file available for download.
Step 2: Define "Good" for the User
From the user's perspective, "good" means:
- The report generation works without errors. (Availability)
- It doesn't take an unreasonably long time. (Latency)
Step 3: Define the SLIs
Based on our definition of "good," we need two SLIs.
-
Availability SLI:
- Good Events: Successfully completed report generation jobs.
- Valid Events: All report generation requests where the user-provided parameters were valid. We exclude requests that fail instantly due to user input error (e.g., an invalid date format).
- SLI Formula:
(Number of successful report jobs) / (Number of valid report job requests)
-
Latency SLI:
- Good Events: Successfully completed report jobs that finished in under, say, 45 seconds.
- Valid Events: All successfully completed report jobs. (We measure latency on the subset of available events).
- SLI Formula:
(Number of successful jobs < 45s) / (Number of successful jobs)
Step 4: Define the SLOs (Set the Thresholds)
This is a negotiation. You'd look at historical performance data from Prometheus or your logs. Let's say you find that today, the system provides 99.8% availability and 95% of reports are generated in under 40 seconds. You might set your initial SLOs slightly aspirational but achievable.
- Availability SLO: 99.9% availability over a rolling 30-day window.
- Latency SLO: 95% of reports generated in under 45 seconds over a rolling 30-day window.
You have now defined clear, measurable performance acceptance thresholds for this user journey. In a performance test, your goal would be to verify that the system can maintain these SLOs under a specific load condition. For example, your acceptance criteria might state: "At 50 concurrent report generation requests, the Latency SLO must not be breached."
Conclusion
In this lesson, we've bridged the gap between raw technical metrics and user-centric value. By starting with a user journey and applying the structured language of SLIs and SLOs, you can define what "good" performance means in a way that is unambiguous, measurable, and actionable. This is a fundamental skill for moving into a senior performance engineering or SRE role, as it allows you to lead conversations about reliability and align your testing efforts with business objectives.
Key Takeaways:
- Performance goals should be tied to critical user journeys.
- SLIs are the raw, quantitative measurements of your service's behavior, best expressed as a ratio of
good events / valid events. - SLOs are the internal targets you set for your SLIs over a time window, defining your standard for "good enough."
- The process is: Identify the journey -> Define what "good" means to the user -> Choose SLIs to measure "good" -> Set an SLO target based on data and business needs.
This lesson concludes our first module on the fundamentals of performance measurement. You now have a complete toolkit for measuring system performance accurately, interpreting the results with statistical rigor, and defining meaningful targets.
In our next module, "Workload Modelling and Controlled Experiments," we will build directly on this foundation. Now that you know how to define your targets with SLOs, we'll learn how to design tests that can accurately validate them. We will begin by exploring how to derive a realistic transaction mix and model user behavior to create workloads that truly represent production traffic.