Hello! In our last lesson, we established a rigorous process for analyzing creative test results, using primary and storytelling metrics to confidently declare winners. You now know how to determine what creative is working and have a foundational understanding of why.
Today, we're going to sharpen that "why" by adding a powerful layer of analysis. A winning creative rarely performs equally well across the board. Its success might be driven by a specific placement, like Instagram Reels, or it might resonate particularly well with a certain age group. Ignoring these variations means leaving money on the table.
This lesson will teach you how to use breakdown reports in Meta Ads Manager to analyze performance variations by placement, audience, and device. Mastering this skill will allow you to pinpoint hidden pockets of profitability, diagnose performance issues, and make much smarter decisions about where to allocate your budget and how to iterate on your creative.
1. Beyond the Average: Introducing Breakdown Reports
When you look at a campaign's overall CPA of $25, you're looking at an average. The reality is that this average is composed of many micro-performances: the CPA on Instagram Feed might be $40, while on Facebook Reels it's $15. Breakdown reports are the tool that allows you to deconstruct that average and see these underlying truths.
The Breakdown dropdown menu in Ads Manager is your gateway to this deeper level of analysis. It enables you to segment your results by various dimensions.
A Guide to Breakdowns in Meta Ads Manager
To start, let's get familiar with what breakdowns are and where to find them. This article by Jon Loomer provides a quick overview.
Read the introduction of the article, stopping just before the "By Time" section. Focus on understanding the purpose of breakdowns and identifying the main categories available.
As you can see, there are several categories. For this lesson, we will focus on the three most critical for creative analysis: Delivery (which includes Placement and Device), Demographics, and Geography.
2. Analyzing Performance by Placement and Device
Your ad's format and message have a huge impact on how it performs in different environments. A 16:9 cinematic video might excel on the Facebook Feed, but get cut off and perform poorly in a 9:16 vertical format like Stories or Reels. The breakdown report is how you verify this.
By segmenting your data by Placement, Device, or Platform, you can answer crucial questions:
- Is my budget being wasted on the Audience Network?
- Are my ads significantly more profitable on Instagram than on Facebook?
- Does my creative work better on mobile or desktop?
Facebook Ads Reporting: How to Spot Trends
The Social Media Examiner channel provides a concise, practical walkthrough of how to access and interpret these reports directly in Ads Manager.
Starting around two minutes in, watch the section on breakdown reports. Pay close attention to how the presenter uses the Placement breakdown to identify performance differences between Facebook and Instagram and suggests creating separate ad sets as a potential action.
This ability to isolate performance is not just an interesting insight; it's an actionable strategy. If you find a creative has a dramatically lower CPA in Stories, you can consider creating a dedicated ad set with Advantage+ Placements turned off, forcing budget only to Stories to scale that specific combination.
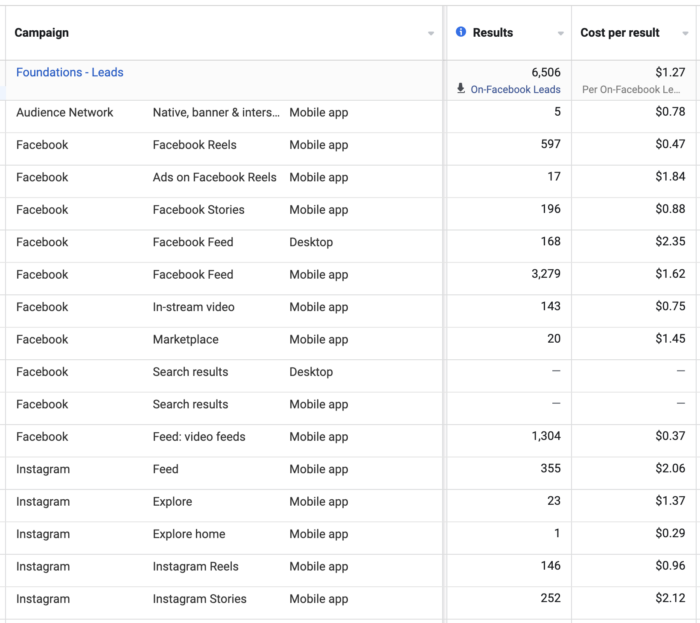
Jon Loomer provides further context on why this is so important, especially for identifying sources of low-quality traffic.
8 Essential Breakdowns to Use in Meta Ads Manager
This article dives into the strategic use of breakdowns to diagnose distribution problems.
Please scroll down to section 2. "Are Distribution Problems Related to Placement?" and read the placement breakdown. This section explains how certain placements, like Audience Network or even Facebook Reels (depending on the campaign objective), can be exploited by the algorithm to generate cheap, but often low-quality, actions.
The key takeaway is to always check your placement data, especially when a campaign's top-level metrics seem "too good to be true."
3. Analyzing Performance by Audience
Just as performance varies by placement, it also varies by the type of person seeing your ad. The "Audience" breakdown encompasses several dimensions, including demographics (age and gender) and geography (country or region).
Using these breakdowns helps you answer questions like:
- Is this creative resonating more with men or women?
- Is there a specific age bracket that is driving most of our profitable conversions?
- If I'm targeting multiple countries, is my budget being spent efficiently across them?
How to Analyze Facebook Ads Data the Right Way (The 2026 Guide)
In this clip, Dara Denney explains how she uses breakdowns as part of her advanced creative analysis to generate deeper insights.
About 28 and a half minutes in, watch the segment where she discusses using breakdown data. Note how she connects insights from age or placement breakdowns to strategic decisions, like developing more creative for a specific high-performing audience.
This type of analysis helps you refine your "ideal customer profile" with real data. You might discover that a creative you thought was for a younger audience is actually performing best with the 45-54 age group.

Again, Jon Loomer provides a sharp analysis of potential pitfalls if you don't monitor these breakdowns.
8 Essential Breakdowns to Use in Meta Ads Manager
This reading expands on the strategic implications of demographic and geographic breakdowns.
Read sections 3. "Are Distribution Problems Related to Age or Gender?" (review the demographic breakdown) and 4. "Are Distribution Problems Related to Country?" (review the country breakdown). He provides a compelling example of how the algorithm, in an attempt to get cheap lead-gen conversions, spent 70% of his budget on an older demographic that produced very low-quality leads.
This highlights a critical point: Meta's algorithm will always optimize for the goal you set, even if it means finding a "loophole" like a demographic that converts cheaply but doesn't lead to valuable customers. Breakdown reports are your primary tool for catching and correcting this.
A Simple Workflow for Breakdown Analysis
Now, let's put this into a step-by-step process you can use every time you analyze your campaigns.
- Select Your View: Navigate to the campaign, ad set, or ad level in Ads Manager. Your analysis can be as broad or as specific as you need.
- Choose One Breakdown: Select the "Breakdown" dropdown and choose a single dimension to start (e.g.,
Delivery > Placement). Applying too many breakdowns at once can make the data unreadable. - Analyze Your Primary KPI: Sort the results by "Amount Spent" to see where the money went, then examine your North Star metric (CPA, ROAS) for each segment.
- Identify Significant Variations: Look for the outliers. Is one placement delivering results at half the cost of others? Is one age group converting at twice the rate?
- Formulate an Action or Hypothesis: Based on your finding, decide on a next step.
- Insight: "Our video creative has a $15 CPA on Instagram Reels but a $50 CPA on Facebook Feed."
- Action: "Duplicate the ad set, and set placements to only Instagram Reels to scale this winning combination."
- Hypothesis for next test: "Vertical, fast-paced videos resonate best. Let's test three new vertical video hooks in our next creative test."
- Repeat (Optional): You can clear the first breakdown and apply another (e.g.,
Demographics > Age) to the same ad to see if other patterns emerge.
Conclusion
You have now moved beyond simply identifying winning ads to understanding the specific contexts in which they win. This granular level of analysis is a hallmark of an advanced media buyer and is fundamental to scaling campaigns profitably.
Here are the key takeaways from today's lesson:
- Averages hide the truth: Use breakdown reports to deconstruct your overall metrics and see the real performance by placement, device, and audience segments.
- Analyze placement to find efficiency: Identify which placements (e.g., Feed, Stories, Reels) are driving your best results and find sources of wasted spend, like the Audience Network.
- Analyze audiences to refine your targeting: Use demographic and geographic breakdowns to understand who your creative truly resonates with, which can inform both future creative and targeting strategy.
- Turn insights into action: A breakdown analysis isn't complete until you've formulated a concrete action, like creating a new ad set for a specific placement, or a new hypothesis for your next creative test.
The insights you've learned to uncover today are the essential inputs for the next stage of our optimization cycle. In our upcoming lesson, you'll learn how to synthesize these findings and develop a creative iteration roadmap that systematically builds upon your learnings.