Welcome back! In our last lesson, you learned how to design a robust creative testing framework from the ground up, covering everything from formulating a hypothesis to structuring your campaigns in Ads Manager. You now have the blueprint for running controlled experiments.
This lesson takes you to the critical next step in the creative optimization cycle: making sense of the data. Launching a test is easy; the real skill lies in interpreting the results correctly to make profitable decisions. Simply picking the ad with the lowest cost-per-purchase on day two can often lead you astray.
Today, you will learn how to analyze creative test results using key metrics and statistical significance to declare winners. We will move beyond surface-level numbers and equip you with a rigorous, multi-layered analysis process. This will ensure that when you declare a creative a "winner," it's a decision backed by data, confidence, and a clear understanding of why it won.
1. The Analyst's Toolkit: Primary vs. Storytelling Metrics
The first step in any analysis is to know which metrics to focus on. A common mistake is to get distracted by "vanity metrics" like a high click-through rate (CTR) that don't actually contribute to your business goals. To avoid this, it's helpful to categorize your metrics into two groups: Primary and Storytelling.
How to Analyze Facebook Ads Data the Right Way (The 2026 Guide)
In her video "How to Analyze Facebook Ads Data the Right Way," Dara Denney provides a powerful framework for categorizing your metrics. This distinction is fundamental to effective analysis.
Please watch the segment from where she explains the difference between Primary and Storytelling metrics. As you watch, focus on: Primary Metrics: What are they (e.g., CPA, ROAS), and what is their sole purpose? Storytelling (or Secondary) Metrics: What are they (e.g., CPM, CTR, Hook Rate), and how do they help you understand performance?
To summarize this crucial concept:
-
Primary Metrics (The "What"): These metrics directly measure business impact and are used for making decisions. They answer the question, "What is working?" This group includes metrics like Cost Per Acquisition (CPA), Return on Ad Spend (ROAS), and the total Number of Purchases/Leads. Your decision to scale an ad or turn it off should be based almost exclusively on these metrics. Before you even launch a test, you must define your single "North Star" metric—the primary KPI that will determine the winner.
-
Storytelling Metrics (The "Why"): These metrics provide the narrative behind the performance. They diagnose why an ad is or isn't working. This group includes Click-Through Rate (CTR), Cost Per Click (CPC), Cost Per Mille (CPM), and video-specific metrics like Hook Rate and Hold Rate. You don't make final decisions based on these, but you use them to understand performance and generate hypotheses for your next round of tests.
2. A Step-by-Step Analysis Framework
With your metrics organized, you can now follow a structured process to analyze your test results. This involves looking at the full customer journey, from the initial impression to the final conversion.
Step 1: Start with the End in Mind (Primary Metrics)
Always begin your analysis by looking at your North Star metric. Sort your ads by the amount spent to see where the budget flowed, and then examine the CPA or ROAS.
How to Analyze Facebook Ads Data the Right Way (The 2026 Guide)
Let's return to Dara Denney's video for a practical demonstration of this process inside Ads Manager.
Watch her campaign analysis from where she applies the framework. Notice her workflow: She first sorts by Amount Spent to prioritize her analysis. She evaluates the campaign's overall health using primary metrics (Total Purchases, CPA, ROAS). She identifies the clear winning ad based on spend and a strong CPA. Only then does she dig into storytelling metrics (like Hook and Hold Rate) to understand why that ad performed so well.
This "top-down" approach keeps you focused on what matters most: profitability. It prevents you from prematurely celebrating an ad with a great CTR that ultimately fails to convert.
Step 2: Diagnose Performance with Storytelling Metrics
Once you've identified a potential winner based on your primary KPI, use storytelling metrics to diagnose its performance and understand where the losers fell short.
The following funnel view is an excellent way to structure this diagnosis:
A Practical Guide to Facebook Ad Creative Testing
This article from the Sovran blog provides a clear, funnel-based approach to creative analysis.
Read the section titled "Looking Beyond Surface-Level Metrics." Pay close attention to the definitions and diagnostic power of each metric in the funnel: Hook Rate: Are you stopping the scroll? Hold Rate: Are you keeping their attention? Click-Through Rate (CTR): Are you inspiring action? Conversion Rate (CVR): Are you closing the deal?
By analyzing performance at each stage, you can pinpoint the exact failure point. For example:
- Low Hook Rate: Your first 3 seconds are ineffective. Test new hooks.
- High Hook Rate, but Low Hold Rate: Your intro is strong, but the body of your ad is boring or irrelevant.
- High CTR, but Low Conversion Rate on the landing page: The ad is compelling, but there's a disconnect between the ad's promise and the landing page experience.
Step 3: Layer in Qualitative Insights
The numbers only tell part of the story. The final step in your diagnosis is to look at the creative itself. What qualitative elements might have contributed to the performance?
How to Analyze Facebook Ads Data the Right Way (The 2026 Guide)
Dara Denney's analysis goes one step further by incorporating qualitative data.
Watch this segment on advanced creative analysis. She breaks down a creative into its core qualities: Format: Was it UGC, a static image, a polished studio video? Creator/Actor: Did a particular person resonate with the audience? Messaging: What angle was used (e.g., value-based, negative marketing, problem/solution)? Imagery/Setting: What was the production quality? Where was it filmed?
This qualitative analysis is what helps you build a library of insights. For example, you might discover that videos filmed in a car consistently outperform those filmed in a home office, or that messaging focused on a specific "trigger word" generates a better response.
3. The Confidence Check: Is Your Winner Statistically Significant?
You've identified a creative that has a 20% better CPA than its competitors. But how can you be sure this isn't just random luck? This is where statistical significance comes in. It's the mathematical confidence check that ensures you're making decisions on a real trend, not random noise.
What Statistical Significance Thresholds Apply to Ad Testing?
This article from ROASPIG is a fantastic primer on the core concepts of statistical significance for marketers.
Please read the following sections: "Why Does Statistical Significance Matter for Ad Testing?" to understand the core problem it solves. "What Are the Key Statistical Concepts?" to familiarize yourself with the terminology (Confidence Level, P-Value). "What Confidence Level Should You Use?" to get practical rules for when to aim for 90%, 95%, or 99% confidence. "What Are Common Statistical Mistakes?" to learn how to avoid pitfalls like "peeking" at results too early.
Here are the practical takeaways for your testing process:
- Aim for 95% Confidence: For most creative tests, this is the industry standard. It means there is only a 5% probability that your results are due to random chance. You can use free online A/B test calculators to check this.
- Ensure Sufficient Sample Size: To achieve significance, you need enough data. A test with only 5 conversions per ad is highly unreliable.
- Time: Let tests run for at least 3-7 days to get past initial volatility.
- Spend/Conversions: Aim for each creative variant to achieve at least 50 conversions. Ideally, you want 100+ for a more reliable result.
- Don't Confuse Statistical with Practical Significance: A 1% improvement in CPA might be statistically significant if you have a massive budget, but it may not be practically significant enough to be worth implementing. Always define the minimum detectable effect you care about before the test.
4. Declaring a Winner and Documenting Learnings
Once your test has run long enough to gather sufficient data and you've confirmed a winner with statistical confidence, the process is simple:
- Declare the Winner: Based on your pre-defined North Star metric, officially declare the winning creative.
- Turn Off the Losers: Pause the underperforming ads and ad sets to consolidate budget behind the winner.
- Document Everything: This is arguably the most important step for long-term growth.
Create a simple spreadsheet or use a tool to log every test. For each test, record:
- The Hypothesis
- Links to the Creatives Tested
- The Primary KPI and Final Results (CPA, ROAS, etc.)
- The Statistical Confidence Level
- Key Takeaways (e.g., "UGC video with a direct-to-camera hook outperformed animated video by 30% CPA with 96% confidence.")
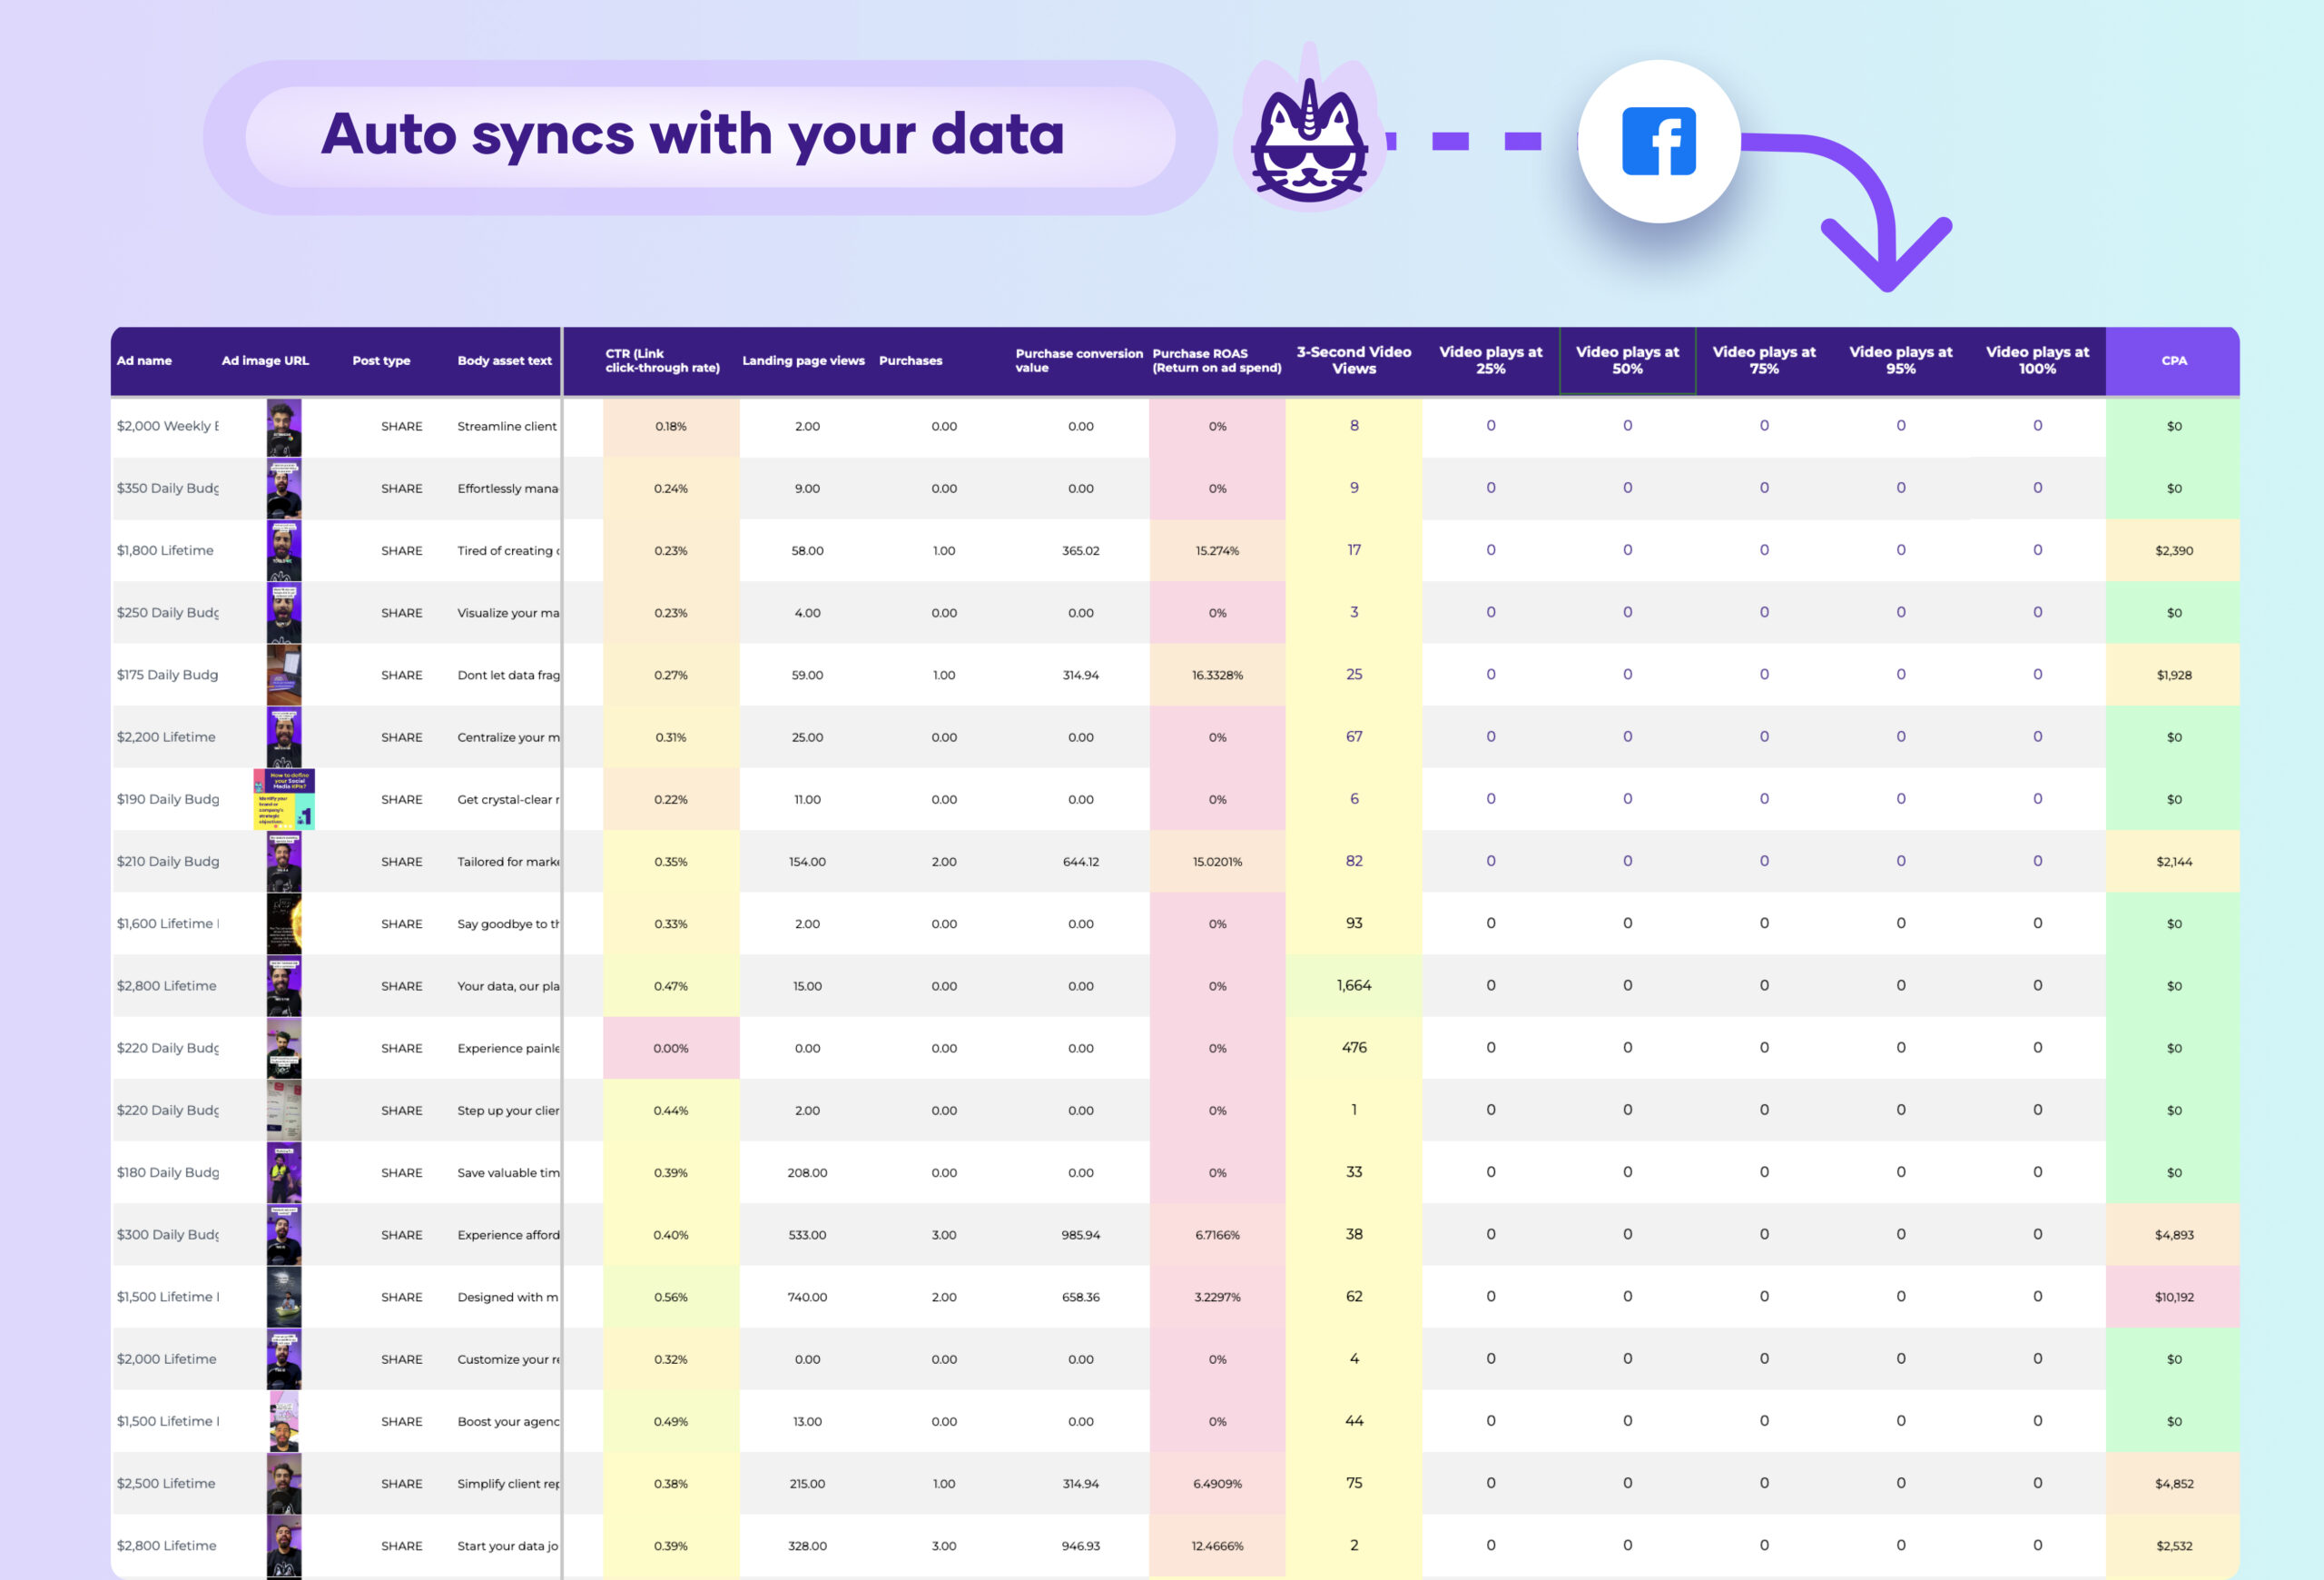
This documentation becomes your internal knowledge base, preventing you from repeating mistakes and allowing you to build on past successes.
Conclusion
You now have a complete framework for moving from raw test data to confident, data-backed decisions. By combining quantitative and qualitative analysis with the rigor of statistical significance, you can systematically identify winning creatives and understand the principles that make them successful.
Here are your key takeaways from this lesson:
- Separate your metrics: Use Primary Metrics (like CPA/ROAS) for making decisions and Storytelling Metrics (like CTR/Hook Rate) for diagnosing performance.
- Analyze the full funnel: A structured analysis moves from the hook and hold rate all the way to the conversion rate to pinpoint exactly where a creative succeeds or fails.
- Trust, but verify: Don't declare a winner until you have statistical significance (aim for 95% confidence) and a large enough sample size (at least 50+ conversions per variant).
- Document every test: Your long-term success depends on building a library of learnings that informs every future creative you build.
In our next lesson, we'll add another layer to your analysis skills. You'll learn how to use breakdown reports to analyze performance variations by placement, audience, and device, allowing you to uncover even deeper insights from your campaign data.