Introduction
In our last lesson, we examined Python's concurrency models and noted that the GIL's existence is partly to simplify memory management in a multi-threaded context. This provides a perfect entry point into today's topic, which is crucial for building reliable, long-running backend services.
Our learning outcome is to describe Python's memory management and garbage collection, and identify common memory leak patterns in long-running services. We will start with the CPython internals of how memory is managed, and then shift our focus to the practical, production-oriented skill of diagnosing and preventing memory leaks—a common and challenging problem that senior engineers are expected to solve.
CPython's Memory Management Model
Python automates memory management, saving you from the manual malloc and free calls common in languages like C. This automation is primarily handled by two mechanisms working together: reference counting and a cyclic garbage collector.
1. Reference Counting: The Primary Mechanism
The core strategy CPython uses is reference counting. Every object in memory has a counter that tracks how many references point to it.
- When a new reference to an object is created (e.g.,
y = x), its reference count is incremented. - When a reference is destroyed (e.g.,
del y, or a variable goes out of scope), its count is decremented. - When the reference count reaches zero, the object's memory is immediately deallocated.
This is a fast and deterministic approach, but it has one major weakness.
2. The Problem: Reference Cycles
Reference counting alone cannot handle objects that refer to each other in a cycle. Consider this example:
# A simple reference cycle
a = []
b = []
a.append(b)  # a now references b
b.append(a)  # b now references a
Here, a has a reference from b, and b has a reference from a. If we now delete the original variables:
del a
del b
The reference counts for the list objects are still 1 because they are referencing each other. Reference counting alone would fail to reclaim this memory, leading to a leak.
3. The Solution: The Generational Garbage Collector
To solve the problem of cycles, Python employs a supplementary garbage collector (GC). The specific job of the GC is to find and break these reference cycles.
To get a solid overview of these concepts, let's watch a talk from a CPython core developer.
Pablo Galindo Salgado - Time to take out the rubbish: garbage collector - PyCon 2019
This PyCon talk, 'Time to take out the rubbish: garbage collector' by Pablo Galindo Salgado, provides an excellent and accessible walkthrough of CPython's memory management, focusing on reference counting and the cycle collector.
Please watch these two segments: Reference Counting (00:39 - 06:30): Focus on how reference counting works and how sys.getrefcount behaves. The Problem with Cycles (06:30 - 09:28): This part clearly illustrates why the garbage collector is necessary and how simple cycles are formed.
CPython's GC is also "generational." This is an optimization based on the weak generational hypothesis: most objects die young. The GC groups objects into three "generations":
- Generation 0 (Young): All new container objects start here. This generation is collected most frequently.
- Generation 1 (Middle-aged): Objects that survive a Generation 0 collection are promoted here.
- Generation 2 (Old): Objects that survive a Generation 1 collection are promoted here. This generation is collected least frequently.
Each generation has a threshold (a number of allocations). When allocations in a generation exceed its threshold, a collection is triggered for that generation.
For a more detailed, code-level explanation of these mechanics, the following article is an excellent resource to study.
CPython Garbage Collection: The Internal Mechanics and Algorithms
The article 'CPython Garbage Collection: The Internal Mechanics and Algorithms' by Abhinav Upadhyay provides a deep dive into the CPython source code. It's a fantastic resource for understanding the implementation details.
Please read the following sections: 'A Short Primer on Reference Counting' and its subsections for a recap. 'Limitations of Reference Counting' for a clear example of a cycle. 'Understanding GC Generations' to solidify the concept of generational collection. 'Object Layout for GC Tracking' to see how CPython adds a 'GC header' to container objects.
The Cycle Detection Algorithm (Interview Deep Dive)
While you don't need to recite the C code, understanding the algorithm's logic is what separates a junior from a senior candidate.
When the GC runs on a generation, it performs the following steps to find and break unreachable cycles:
-
Find Potential Garbage: The GC traverses all objects in the generation. It makes a copy of each object's real reference count (
ob_refcnt) into a temporary field (gc_refs). Then, it traverses all objects again. For each object, it finds all other objects it references and decrements theirgc_refscounter. After this, any object with agc_refs > 0must have a reference from outside the group of objects being collected. These are marked as "reachable". -
Identify True Garbage: The remaining objects (with
gc_refs == 0) are tentatively considered "unreachable." However, one of these might be referenced by a "reachable" object. The GC iterates through the "reachable" objects. Any object they reference that is currently in the "unreachable" set is "rescued" and moved back to the "reachable" set. This process repeats until no more objects can be rescued. Whatever is left in the "unreachable" list is truly garbage. -
Break the Cycles: For each object in the final "unreachable" list, the GC calls a special internal method (
tp_clear). This method is implemented by container types (like lists and dicts) to clear their internal references (e.g.,list.clear()). This action breaks the reference cycle. -
Deallocation: Once the cycles are broken, the objects' real reference counts (
ob_refcnt) naturally drop to zero, and the standard reference counting mechanism deallocates their memory.
A key complexity here involves objects with __del__ methods. If an object within a cycle has a __del__ method, Python cannot determine a safe order to destroy the objects, so it leaves them, placing them in the gc.garbage list. This is a common source of "uncollectable" memory.
From Theory to Practice: Memory Leaks in Python
In a language with garbage collection, a "memory leak" isn't memory that is lost forever. It's memory that is still referenced by your application but is no longer needed. The GC can't clean it up because it's still technically reachable. In long-running services, this leads to steadily increasing memory consumption and eventual OOM (Out Of Memory) kills.
Identifying the source of these unwanted references is a critical skill.
Common Memory Leak Patterns
Let's review the most common patterns you'll encounter in backend services.
How to Handle Memory Leaks in Python
The article 'How to Handle Memory Leaks in Python' from OneUptime provides an excellent, practical guide to common leak patterns with clear 'BAD' vs. 'GOOD' code examples.
Read the entire section 'Common Memory Leak Patterns'. Pay close attention to each of the five patterns, especially the solutions using LRU caches, weak references, and explicit cleanup.
Here is a summary of the key patterns from the article:
- Unbounded Caches: Using a
dictas a cache without a size limit. Every new key adds an entry that is never removed.- Fix: Use a bounded cache like
functools.lru_cacheor a custom TTL cache.
- Fix: Use a bounded cache like
- Event Handler/Callback Leaks: An event emitter holds strong references to its listeners. If a listener is a method of an object (
self.handle_event), the emitter keeps the entire object alive.- Fix: Use
weakrefto store references to listeners, or provide an explicitunsubscribe()mechanism.
- Fix: Use
- Closure Leaks: A closure can accidentally capture a large object from its enclosing scope, even if it doesn't use it, keeping that object in memory.
- Fix: Extract only the necessary data into local variables before defining the closure, or use a class instead.
- Circular References with
__del__: As mentioned, the GC cannot clean up cycles containing objects with__del__methods.- Fix: Avoid
__del__. Use context managers (withstatement) for cleanup. If you must use cycles, useweakreffor back-references (e.g., a child's reference to its parent).
- Fix: Avoid
- Thread Local Leaks: In a thread pool, threads are reused. Data stored in
threading.local()can accumulate across multiple tasks/requests if not cleared.- Fix: Ensure data is cleaned up in a
finallyblock after each task. In modern Python (3.7+),contextvarsare often a safer alternative for async code.
- Fix: Ensure data is cleaned up in a

Debugging Memory Leaks: Your Toolkit
When you suspect a memory leak, you need a systematic approach and the right tools.
1. The gc Module
For low-level inspection of the garbage collector itself.
gc.set_debug(gc.DEBUG_LEAK): Prints information about uncollectable objects.gc.garbage: A list of objects that the GC found to be uncollectable. Inspecting this can be very revealing.gc.get_objects(): Returns a list of all objects tracked by the GC.gc.get_referrers(obj): Returns a list of objects that refer toobj. Essential for tracking down unwanted references.
2. tracemalloc
The built-in library for tracing memory allocations. This is your first and best tool for finding the source of a leak.
The typical workflow is:
tracemalloc.start()snapshot1 = tracemalloc.take_snapshot()- Run the code that is suspected of leaking.
snapshot2 = tracemalloc.take_snapshot()top_stats = snapshot2.compare_to(snapshot1, 'lineno')- Print
top_statsto see which lines of code were responsible for the new memory allocations.
3. memray and Flame Graphs
For more complex leaks, especially those involving C extensions, memray is a powerful, production-ready memory profiler from Bloomberg. It can generate flame graphs that visualize where memory is being allocated.
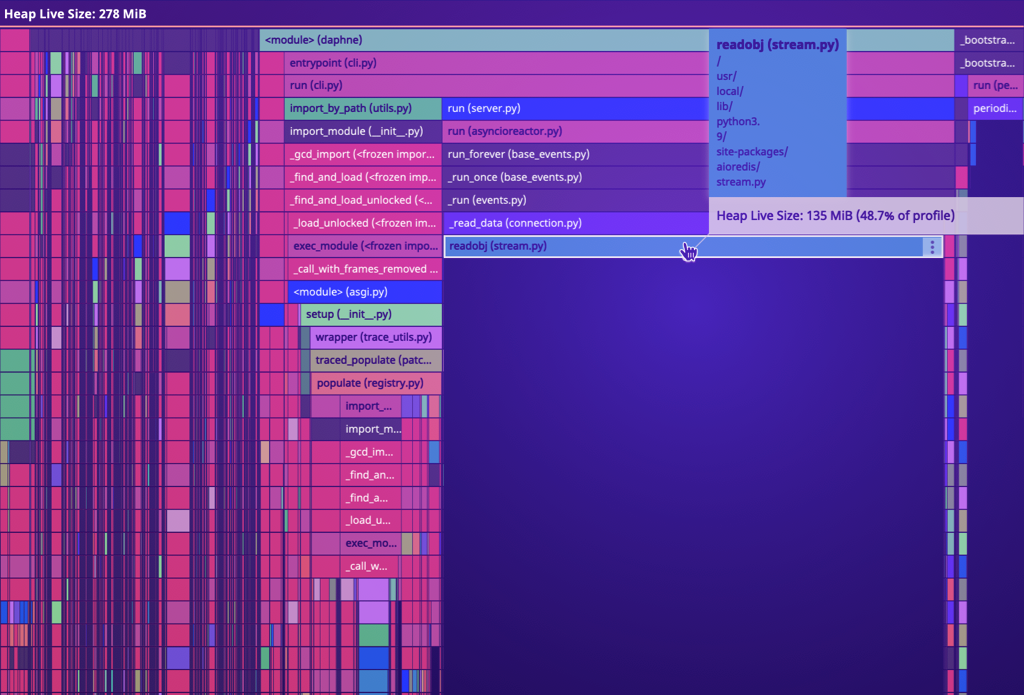
To see a senior engineer's workflow for debugging a real-world memory leak, this video is an outstanding resource.
using memray to debug (and fix) a memory leak in krb5! (advanced) anthony explains #567
This video, 'using memray to debug (and fix) a memory leak in krb5!' from anthonywritescode, is an advanced, practical demonstration. It shows the end-to-end process of identifying a leak, isolating it, and using native tools to fix it in a C library.
Watch the whole process. Don't worry about the specifics of the C code. Focus on the methodology: Observing the leak with htop. Using memray to generate a flame graph and identify the leaky function area. Enabling options like follow-fork for child processes and --native to trace C-level allocations. Creating a minimal C program to reproduce the issue in isolation. Using system-specific tools (leaks on macOS) to confirm the source in the C code before fixing it.
Interview Scenario: The Leaky Service
Question: "You're responsible for a long-running microservice deployed in Kubernetes. The pod is being OOMKilled every 24 hours. Memory usage on your dashboards shows a slow, steady climb. How do you approach this problem?"
Structured Answer:
-
"My first step is observation and instrumentation. I'd confirm the memory growth pattern using our existing monitoring (e.g., Prometheus). I'd add metrics to track the number of objects tracked by the GC (
len(gc.get_objects())) and the size ofgc.garbageto see if we have uncollectable cycles." -
"Next, I'd try to reproduce the leak in a controlled environment. I would set up a staging environment and use a load generator (like Locust) to simulate production traffic. This is critical for safely using more invasive debugging tools."
-
"In the staging environment, I'd use
tracemalloc. I'd configure the service to take periodic memory snapshots. By comparing snapshots taken hours apart, I can identify the specific lines of code responsible for the memory growth. This usually points directly to the leak." -
"Based on the
tracemallocoutput, I'd investigate for common leak patterns.- "If the growing objects are in a dictionary, I'd suspect an unbounded cache.
- If the trace points to event handling or a callback system, I'd look for listeners not being cleaned up, suggesting a need for weak references.
- If a specific custom object type is growing, I'd use
objgraphto visualize its back-references (objgraph.show_backrefs()) to see what's preventing it from being collected."
-
"If the leak isn't obvious from Python code, I'd suspect a C extension. I would then use a more powerful profiler like
memraywith the--nativeflag. This would help me see if the leak is originating from a library likepsycopg2ornumpy, as demonstrated in the video." -
"Finally, after forming a hypothesis and implementing a fix (e.g., replacing a dict cache with
lru_cache), I would re-run the load test in the staging environment to confirm that memory usage is now stable before deploying to production."
Conclusion
Understanding Python's memory model is not just academic; it's a practical necessity for building robust backend systems.
Key Takeaways:
- Python uses reference counting for immediate object deallocation and a generational garbage collector specifically to handle reference cycles.
- Memory leaks in Python are caused by unwanted references, not "lost" memory. Your job is to find and eliminate these references.
- Be able to identify common leak patterns: unbounded caches, callback/handler leaks, closure captures, and un-cleared thread-local storage.
- Your primary toolkit for debugging leaks includes
tracemallocfor finding allocation sources,gcfor inspecting collector state, and more advanced tools likeobjgraphandmemrayfor deep analysis.
Preview of the Next Lesson:
We have now concluded our deep dive into advanced Python internals. We are ready to move up a level of abstraction. In the next module, "Core Backend Architecture," we will begin by tackling one of the most fundamental architectural decisions you'll face: analyzing the trade-offs between monolith and microservices architectures.