Introduction
In our last lesson, you built a robust retry decorator, a key pattern for building resilient systems that can handle transient failures. However, even with the best resilience patterns, production systems can and do experience performance degradation. Knowing how to react when an alert for "high latency" fires is a critical skill that separates senior engineers from the rest. This is not just a technical exercise; it's a test of your systematic thinking, diagnostic process, and ability to perform under pressure.
This lesson will equip you with that skill. Our goal is to walk through a systematic process for diagnosing a sudden API latency spike, from initial alert to root cause analysis. We will cover the frameworks, tools, and thought processes that impress interviewers and, more importantly, are effective in solving real-world production incidents.
1. The Interview Question: "Your API is Slow. What Do You Do?"
Imagine you are on-call. An alert fires: p99 latency for a critical API endpoint has jumped from 200ms to over 5 seconds. Users are reporting timeouts. This is a classic, open-ended interview scenario designed to test your entire approach to problem-solving.
To understand the interviewer's perspective, let's start with a video that frames this exact problem.
I ask this question to every Backend Engineer I interview
Hussein Nasser, a popular backend engineering educator, uses this type of question to evaluate candidates. In this video, he explains the scenario and what he looks for in an answer.
Watch the following two segments: The Question (02:48 - 06:22): Pay attention to the simple stack he describes (client, reverse proxy, web server, database) and the open-ended nature of the problem: a 60-second freeze. What the Answer Reveals (06:22 - 08:24): Notice how he emphasizes that candidates reveal their strengths and passions by where they choose to start digging. This shows there isn't one 'right' path, but a structured process is key.
As the video highlights, the goal isn't to guess the correct cause immediately. The goal is to demonstrate a logical, methodical investigation that narrows down the possibilities.
2. The Framework: A Systematic Approach to Diagnosis
A structured approach prevents you from chasing red herrings. A proven methodology involves moving from a high-level service view down to specific resource or code-level issues.
Step 1: Check Service-Level Indicators (The RED Method)
Before diving into servers, start with what your users are experiencing. The RED Method provides a perfect framework for this initial assessment.
- Rate: The number of requests per second.
- Errors: The number of requests resulting in an error.
- Duration: The time it takes for requests to complete (latency distribution, e.g., p50, p95, p99).
By looking at these three metrics on your primary observability dashboard, you can form an initial hypothesis:
- Latency spike + Rate spike? Suggests a traffic surge, a denial-of-service attack, or a client-side retry storm.
- Latency spike + Error spike? Points to a failing downstream dependency or a partial service outage.
- Latency spike only? Suggests an internal bottleneck in your service, like resource contention or an inefficient code path.
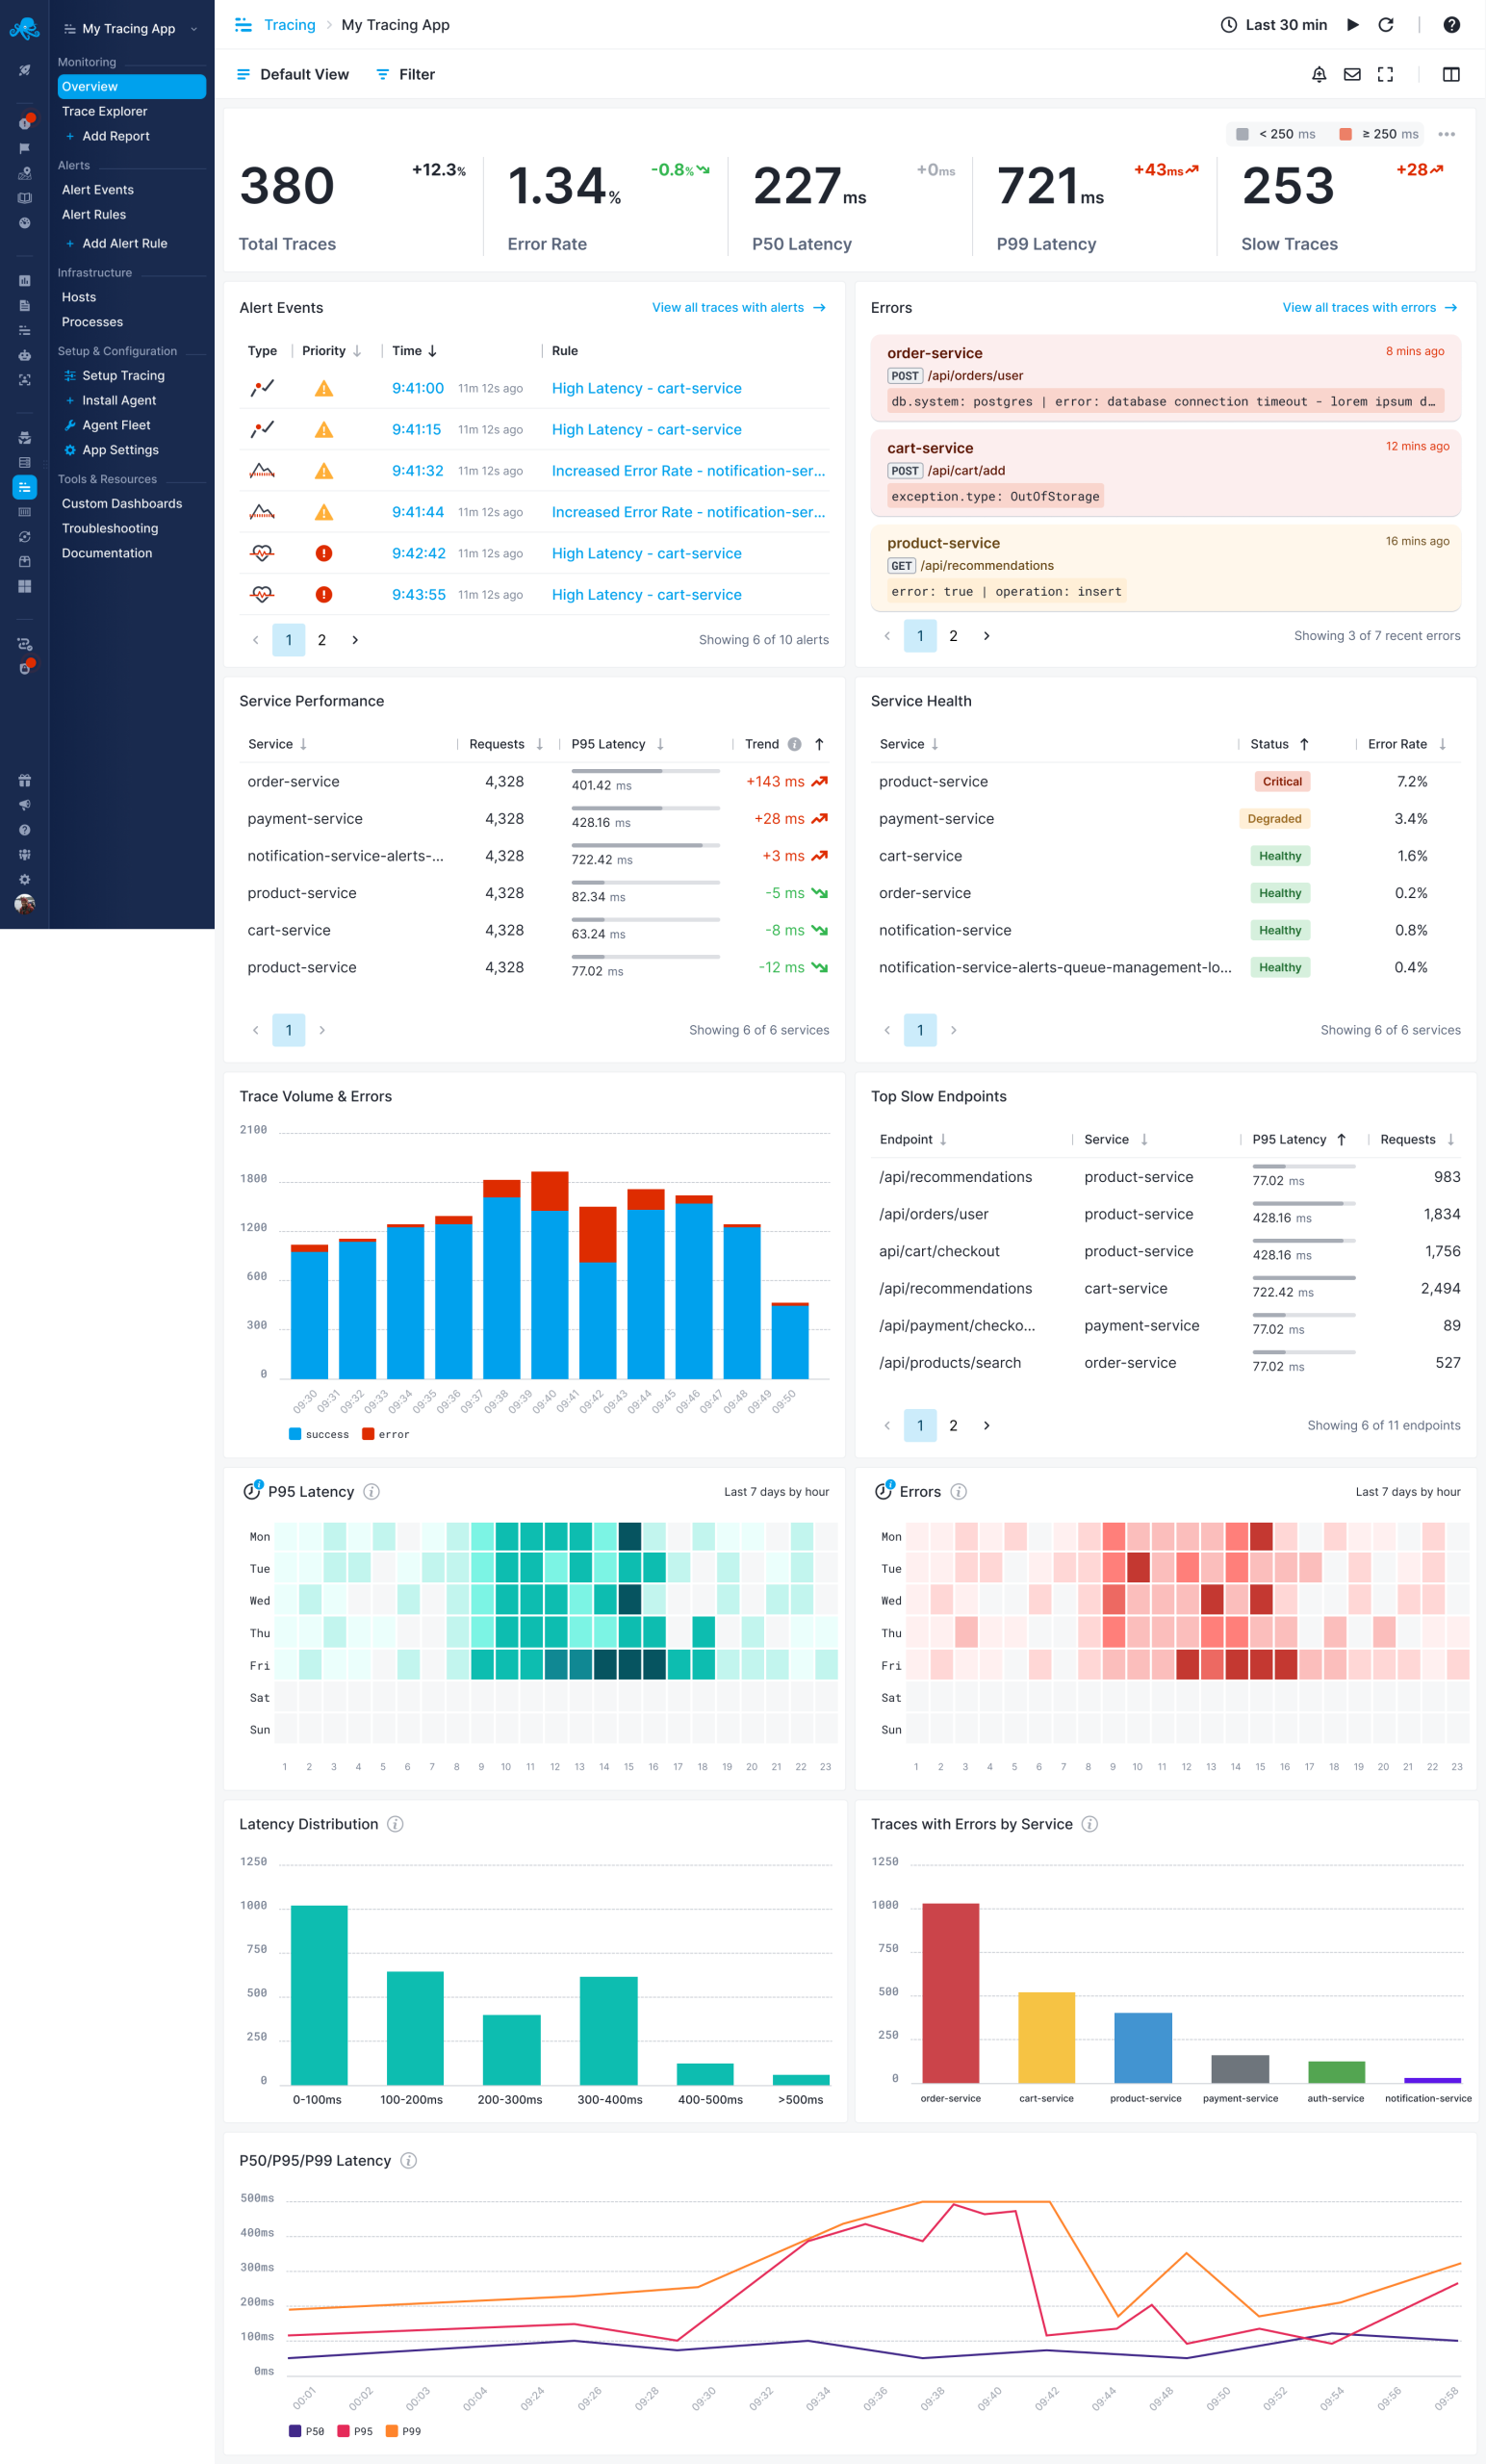
Step 2: Correlate Metrics with Logs and Traces
Metrics tell you what is wrong, but logs and traces tell you why.
Logs vs. Metrics: Why You Need Both for Observability
This article from LogicMonitor clearly explains the symbiotic relationship between metrics and logs in troubleshooting.
Read the sections 'TL;DR', 'Cut MTTR with a Two-Step Process', and 'Faster Root Cause Analysis...'. Focus on the core idea: start with metrics to spot the issue, then dive into logs for the detailed story. The four-step process (Detection, Triage, Diagnosis, Resolution) is a great mental model for incident response.
Your next action is to find a distributed trace for one of the slow requests. The trace waterfall will immediately show you which part of the request lifecycle is consuming the most time:
- Is it a long span within your application code?
- Is it a long span representing a database query?
- Is it a long span for an HTTP call to a downstream service?
This allows you to isolate the problem to a specific component.
3. Drilling Down: From Hypothesis to Root Cause
Once you've isolated the problematic component, you need to dig deeper using more specific tools and frameworks.
How to Track Down the Real Cause of Sudden Latency Spikes
This article from Last9 provides an excellent overview of common latency culprits and the methodologies used to find them. It's a goldmine for interview talking points.
Read these three sections: 'What Actually Causes Latency Spikes': Familiarize yourself with the common culprits: DB connection pool exhaustion, GC pauses, network retransmissions, and CPU saturation. '3 Debugging Methodologies...': We've covered the RED method. Now, understand the USE Method (Utilization, Saturation, Errors) for infrastructure and the Four Golden Signals for service health. 'FAQs': The answers here are concise and directly address common interview follow-up questions.
Let's put this into practice with a few scenarios.
Scenario A: The Trace Points to Your Application Server
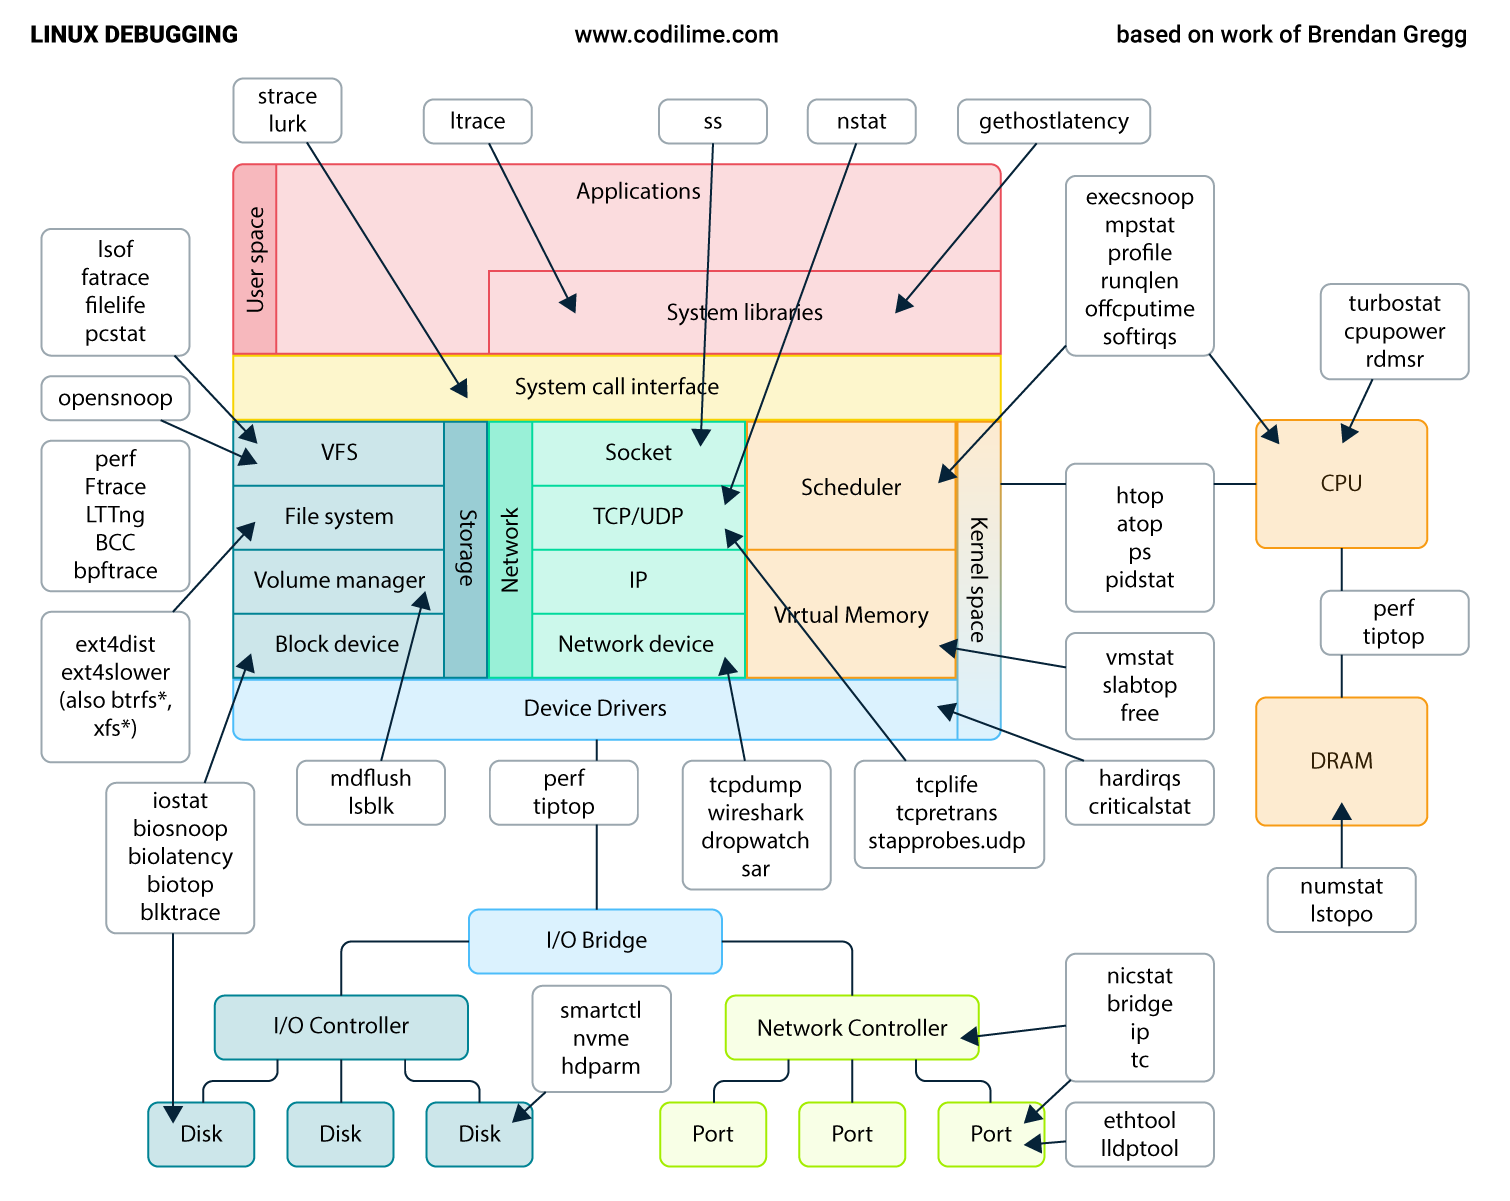
The distributed trace shows that your service is the bottleneck. The latency is within your application code, not in external calls. Now you apply Brendan Gregg's USE Method to the server itself.
- Utilization: How busy is the resource (e.g., CPU is 90% utilized)?
- Saturation: Is there a queue of work that cannot be serviced (e.g., CPU run queue length is high)?
- Errors: Are there any resource-specific errors (e.g., out-of-memory errors)?
The following video demonstrates a hands-on diagnosis of performance issues on a Linux server, which is the environment most backend services run in.
Linux Performance Troubleshooting Demos
This video provides three practical demos of diagnosing server-side performance issues using standard Linux command-line tools. This is the hands-on skill that backs up the theoretical frameworks.
Watch all three demos to see how a process of elimination works in practice: Demo 1 (00:07 - 04:20): Shows how top, vmstat, and iostat are used to identify a disk I/O bottleneck. Notice how high iowait (%wa) in vmstat is the key signal. Demo 2 (04:54 - 07:42): Demonstrates finding an application bug (an infinite loop of read system calls) using vmstat, pidstat, and finally strace to see the actual system calls being made. Demo 3 (07:47 - 10:30): A more advanced scenario where top doesn't show the culprit. The tool perf is used to find short-lived processes causing high CPU usage. Mentioning perf shows deeper knowledge.
Scenario B: The Trace Points to the Database
The trace shows a single database query is taking seconds.
- Hypothesis 1: Connection Pool Exhaustion. Your service's connection pool metric would show active connections are at or near the maximum limit. New requests are queuing up waiting for a connection.
- Hypothesis 2: Slow Query. You would extract the query from the trace, run
EXPLAIN ANALYZEon it in PostgreSQL, and look for a full table scan or other inefficiencies. The fix might be adding an index, a topic we covered previously. - Hypothesis 3: Lock Contention. The query might be blocked by another transaction holding a lock. You'd use database-specific views (like
pg_stat_activityandpg_locksin PostgreSQL) to investigate waiting queries.
Scenario C: The Trace is Inconclusive, but Latency is High
Sometimes the application and database seem fine. The Last9 article gave a brilliant clue for this: look at the pattern of latency. If spikes follow a sequence like 1s, 3s, 7s, 15s, this strongly suggests TCP packet retransmissions due to network issues between services. This is a very impressive observation to bring up in an interview.
4. Structuring Your Interview Answer
Now, let's synthesize this into a structured answer.
Interviewer: "p99 latency for your /checkout endpoint just spiked from 300ms to 8 seconds. Walk me through how you'd investigate."
Your Answer:
-
Acknowledge and Scope: "My first step is to check our service's primary dashboard to understand the scope. I'm looking at the RED metrics: Rate, Errors, and Duration.
- Did the request Rate spike? This could point to a traffic surge.
- Did the Error rate also spike? This could mean a downstream service is failing.
- If only the Duration (latency) is high, it suggests an internal bottleneck."
-
Isolate with Tracing: "Next, I'll grab a distributed trace for a slow
/checkoutrequest. The trace waterfall will immediately tell me where the time is being spent—in the API gateway, thecheckoutservice, thepaymentservice, or the database." -
Drill Down with a Hypothesis: "Let's assume the trace shows the latency is within the
checkoutservice itself. My hypothesis is a resource bottleneck. I'll apply the USE method to the server instance.- I'll SSH into the machine and start with
toporhtopto check for CPU utilization. - If CPU is high, I'll use
pidstatto confirm it's my application process. Then, I might useperf recordto sample the CPU stack and see which functions are hot. - If CPU seems fine, I'll check
vmstatfor memory pressure (swapping) or highiowait, which points to a disk I/O problem. I'd confirm that withiostat. - If the issue seems to be with system calls,
stracecan reveal if the application is stuck in a tight loop of reads or writes."
- I'll SSH into the machine and start with
-
Consider Other Culprits: "If the server resources look fine, I'd investigate other common culprits. I'd check our GC logs for long 'stop-the-world' pauses. If the trace showed a long database query, I'd move to analyzing that query with
EXPLAIN ANALYZE." -
Communicate and Mitigate: "Throughout this process, I'd be communicating my findings in the team's incident channel. Once I have a likely root cause—say, a missing index—the immediate mitigation might be to roll back the code that introduced the query, while the long-term fix is to deploy a migration that adds the index."
Conclusion
You now have a robust, multi-layered framework for diagnosing latency spikes. This approach—moving from high-level service metrics (RED) to infrastructure metrics (USE) and then to specific code/system-level tools (perf, strace)—demonstrates the structured, calm, and methodical thinking that defines a senior backend engineer.
Key Takeaways:
- Start with service-level metrics (RED): Understand the user impact (Rate, Errors, Duration) before diving deep.
- Use distributed traces to isolate: Find the component (your service, a dependency, the database) responsible for the delay.
- Apply the USE method for resource bottlenecks: Systematically check for Utilization, Saturation, and Errors on CPU, memory, disk, and network.
- Master a few key command-line tools: Knowing when to use
top,vmstat,iostat,strace, andperfis a powerful skill. - Always have a list of common culprits: Keep DB connection pools, GC pauses, and network issues in your mental checklist.
Preview of the Next Lesson:
Diagnosing a technical problem is one type of interview challenge. Another, equally important one, is communicating your experience and ownership. In our next lesson, we will shift from a technical debugging scenario to a behavioral one. You will learn how to develop a structured response for a behavioral question about a past project failure using the STAR method, focusing on ownership, impact, and lessons learned.