Introduction
In our previous lessons, we focused on determining if a statistically significant association exists between two categorical variables using tests like the chi-square test and Fisher's exact test. Now, we move to the next logical question: if an association exists in a 2x2 table, how do we describe its strength and direction?
This lesson introduces two fundamental measures of association: the Relative Risk (RR) and the Odds Ratio (OR). Both quantify the relationship between an exposure (like a treatment or a risk factor) and an outcome (like a disease or recovery), but they do so in different ways and are appropriate for different situations.
Your goal for this lesson is to master the decision-making process for choosing between them. By the end, you'll be able to identify from a problem description—specifically the study design—whether to report the relative risk or the odds ratio, a skill crucial for your exam.
Risk vs. Odds: A Quick Refresher
Before we dive in, let's clarify two terms that are often used interchangeably in everyday language but have precise statistical meanings.
-
Risk (or Probability): The likelihood of an event occurring. It's calculated as the number of times the event of interest happens divided by the total number of people.
For example, if 10 out of 100 people develop a disease, the risk is or 10%.
-
Odds: The ratio of the probability of an event happening to the probability of it not happening.
In the same example, 10 people developed the disease and 90 did not. The odds are .
As you can see, risk and odds are related but numerically different. This distinction is the foundation for understanding relative risk and odds ratios.
Relative Risk and Odds Ratio: Calculation and Interpretation
Let's watch a video that provides an excellent walkthrough of calculating and interpreting both measures using a single, clear example. This will help solidify the difference between them.
Relative Risk vs Odds Ratio! EXTENSIVE VIDEO!
This video from zedstatistics provides an exceptionally clear explanation of Relative Risk and Odds Ratio. We will watch the first part to see how each is calculated from the same 2x2 table.
Watch the segments from 01:09 to 06:40. Focus on: The definition and calculation of Relative Risk (RR) for the obese vs. healthy groups. The definition and calculation of the Odds Ratio (OR) for the same data. Note how the final number and its interpretation differ slightly between RR and OR.
Summary of Calculations
Let's use the standard 2x2 table format to summarize the formulas from the video:
| Disease (D+) | No Disease (D-) | Total | |
|---|---|---|---|
| Exposed (E+) | A | B | A + B |
| Unexposed (E-) | C | D | C + D |
-
Relative Risk (RR): The ratio of the risk in the exposed group to the risk in the unexposed group.
Interpretation: "The risk of the disease is RR times as high in the exposed group compared to the unexposed group."
-
Odds Ratio (OR): The ratio of the odds of disease in the exposed group to the odds of disease in the unexposed group.
Interpretation: "The odds of the disease are OR times as high in the exposed group compared to the unexposed group."
For both measures, a value of 1.0 is the null value, indicating no association between the exposure and the outcome. A value greater than 1.0 suggests a positive association (increased risk/odds), while a value less than 1.0 suggests a negative or protective association (decreased risk/odds).
The Deciding Factor: Study Design
So, if you can calculate both, which one should you use? The answer hinges almost entirely on the study design, because that determines whether you can legitimately calculate risk.
There are two main types of observational studies you'll encounter:
-
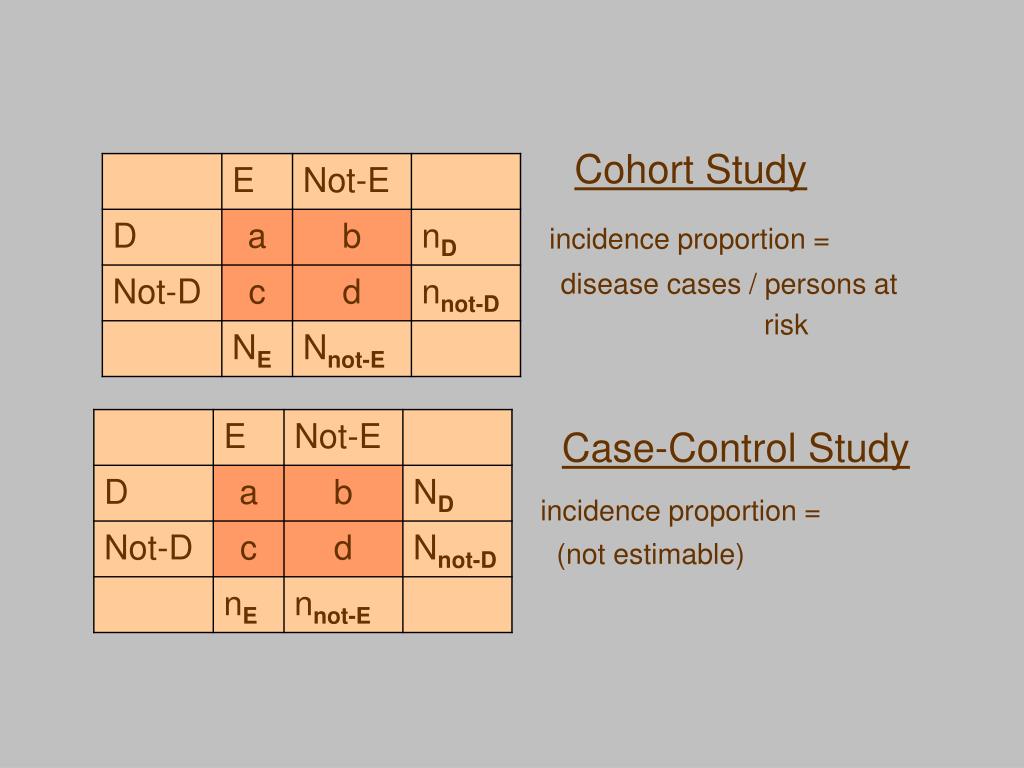
Cohort Studies (and RCTs): These studies start with a disease-free group of people. They identify who is "exposed" and who is "unexposed" and then follow them over time to see who develops the disease. Because you are observing new (incident) cases develop in a defined group, you can calculate the true risk of the disease for both the exposed and unexposed groups.
- Decision: For cohort studies and Randomized Controlled Trials (RCTs), Relative Risk (RR) is the preferred measure. It is more direct and intuitive.
-
Case-Control Studies: These studies work backward. Researchers start by identifying a group of people who already have the disease ("cases") and a comparable group who do not ("controls"). Then, they look back in time (retrospectively) to determine the proportion of each group that was exposed to the factor of interest.
- Decision: You cannot calculate risk or RR in a case-control study. The proportion of cases in your sample is fixed by you, the researcher (e.g., 100 cases and 100 controls), so it doesn't represent the true incidence in the population. Therefore, you must use the Odds Ratio (OR).
The following video segment and image perfectly illustrate this crucial distinction.
Relative Risk vs Odds Ratio! EXTENSIVE VIDEO!
Let's continue with the zedstatistics video. This next part explains exactly why you can't use RR for a case-control study and why OR is the necessary alternative.
Watch the segment from 06:40 to 14:05. Pay close attention to the lung cancer example. Understand why trying to calculate risk in this case-control setup doesn't make sense, but calculating the odds ratio is still valid.
The "Rare Disease Assumption"
You might have noticed in the video that the OR (2.25) was larger than the RR (2.0) for the same data. This is always true when the association is positive. The OR will always be further from the null value of 1.0 than the RR.
However, there is a special situation where they are very close: the rare disease assumption.
- When a disease is rare in the population, the number of people with the disease is small compared to the number without it.
- This means that for the unexposed group, , and for the exposed group, .
- Consequently, the RR formula, , becomes approximately , which is the formula for the OR.
Why this matters for your exam: In a case-control study where you can only calculate an OR, if the problem states that the disease is rare, you can interpret the OR as an approximation of the RR. If the disease is common, the OR significantly overestimates the RR, and you should be cautious about this exaggeration.
Putting It All Together: A Decision Guide
For your exam, use this clear decision-making process when a question asks for a measure of association strength.
- Identify the Study Design:
- Does the study start with exposed/unexposed groups and follow them over time to see who gets a disease?
- YES -> Cohort Study or RCT. Your preferred measure is Relative Risk (RR).
- Does the study start with people who have a disease (cases) and people who don't (controls) and look backward at exposures?
- YES -> Case-Control Study. You must use the Odds Ratio (OR).
- Does the study take a "snapshot" in time, assessing exposure and disease status simultaneously?
- YES -> Cross-Sectional Study. The standard measure is the Odds Ratio (OR).
- Does the study start with exposed/unexposed groups and follow them over time to see who gets a disease?
This is the most critical distinction. The table below from an Oregon State University textbook summarizes this perfectly.
Introduction to 2x2 Tables, Epidemiologic Study Design, and Measures of Association
This textbook provides a fantastic summary of the different study designs and their preferred measures of association. It's a great reference to solidify what we've learned.
Scroll to the very end of the webpage to the summary table. Review how it cleanly maps Cohort/RCT designs to Risk Ratio and Case-Control/Cross-sectional designs to Odds Ratio.
The flowchart below provides a final visual summary of the correct usage of these measures.
Correct and Incorrect Usage of HR, OR, and RR
This flowchart summarizes the appropriate uses of different statistical measures. For our purposes, focus on the paths for RR and OR. It clearly shows that RR is used for cohort studies, while OR is used for case-control studies and is often seen in logistic regression (a topic we will cover soon).
Conclusion
You have now learned to distinguish between relative risk and odds ratio, two essential measures for quantifying the strength of an association in a 2x2 table.
Key Takeaways:
- Relative Risk (RR) is a ratio of two risks (probabilities). It is the preferred measure for cohort studies and RCTs because it is more intuitive.
- Odds Ratio (OR) is a ratio of two odds. It is the necessary measure for case-control studies (where risk cannot be calculated) and the standard for cross-sectional studies.
- The choice between RR and OR is determined by the study design.
- The rare disease assumption states that when an outcome is uncommon, the OR provides a good approximation of the RR. When the outcome is common, the OR exaggerates the strength of the association compared to the RR.
This lesson forms a crucial bridge. We've completed our look at foundational contingency table analysis. The odds ratio, in particular, will reappear as a central element when we move into our next topic: an introduction to Generalized Linear Models (GLMs), starting with the motivation for why we need them and their basic structure.