Hello! Welcome to the final lesson of your intensive exam preparation course.
Throughout this course, we've moved from the foundations of categorical data to the mechanics of contingency table analysis and finally to the predictive power of Generalized Linear Models, especially logistic regression. You've learned how to execute and interpret these powerful methods.
In this capstone lesson, we'll shift our focus from doing the analysis to choosing the analysis. Your exam will present you with various scenarios, and your first, most critical task will be to correctly identify the right statistical tool for the job. This lesson is designed to equip you with a clear, systematic decision-making framework to do just that.
Our learning outcome is to: From a list of mixed problem descriptions, correctly identify the required statistical analysis for each without solving.
By the end of this session, you'll have a mental flowchart to confidently navigate any problem description and pinpoint the appropriate method, a skill that is crucial for success on your exam.
1. The Master Decision Framework
The key to choosing the correct statistical test is to ask a series of structured questions. The most important question is always:
What is the type of my response (or outcome) variable?
The answer to this question is the first major fork in the road. Let's look at a high-level map.

Our course has covered two main branches of analysis that stem from this question:
- Categorical Response Variable: This leads us toward contingency table analyses (Chi-Square, Fisher's) or Logistic Regression.
- Quantitative (but non-normal) Response Variable: This leads us toward other GLMs, like Poisson or Gamma Regression.
Let's break down each path.
2. Path 1: The Response Variable is Categorical
If your outcome is categorical (e.g., yes/no, pass/fail, Democrat/Republican/Independent), your next question should be about your predictors and your goal.
Is your goal to test for an association between categorical variables?
If all your variables are categorical and you want to see if they are related, you're in the realm of contingency table analysis.
Now, you have two follow-up decisions:
Decision A: Independence vs. Homogeneity?
Your choice here depends on the study design. The resource below provides an excellent explanation.
Categorical Data Analysis: Sampling Designs
Please read the following section from the 'Categorical Data Analysis' guide. It clearly distinguishes between two fundamental types of contingency table tests based on how the data was sampled.
Read the section titled 'Sampling Designs'. Focus on the difference between 'Design 1: Total Sample Size Fixed' and 'Design 2: Row Totals Fixed'. This will clarify when to test for independence versus homogeneity.
In summary:
- Test of Independence: Use when you have a single random sample that you cross-classify by two variables. The row and column totals are random. Question: "Is there an association between variable A and variable B?"
- Test of Homogeneity: Use when you have two or more separate samples (the row or column totals are fixed) and you compare the distribution of a second variable across them. Question: "Is the proportion of outcomes for variable B the same across the different groups of variable A?" This is where analyzing by row or column percentages becomes important.
Decision B: Chi-Square vs. Fisher's Exact Test?
This decision is based on sample size and expected cell counts.
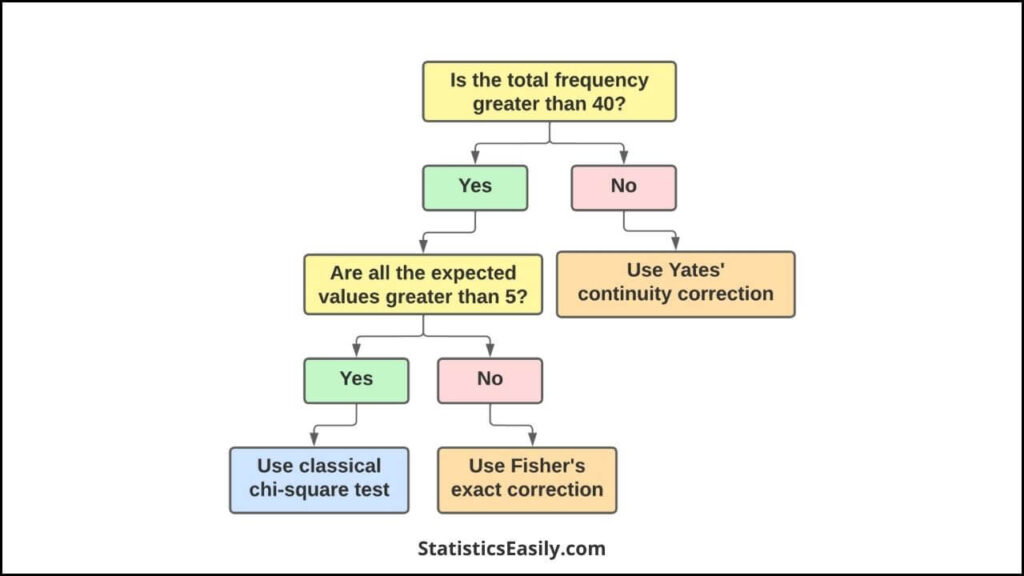
To confirm, review this summary table.
Comparison of tests for categorical association
This table from the 'Categorical Data Analysis' guide summarizes the key differences between the tests.
Review the table under the 'Key Takeaways' section. Note the 'Sample Size Suitability' and 'Statistical Assumptions' columns for Fisher's Exact Test and the Pearson Chi-Square Test.
Is your goal to predict a categorical outcome from predictors?
If you want to build a predictive model for a categorical outcome, especially if you have continuous predictors, you should use Logistic Regression.
- Binary Response (2 categories): Binary Logistic Regression.
- Nominal/Ordinal Response (>2 categories): Multinomial or Ordinal Logistic Regression.
3. Path 2: The Response Variable is Quantitative (Count or Skewed)
If your outcome is a number, but it doesn't follow a normal distribution, you'll likely need a GLM other than standard linear regression.
Understanding Generalized Linear Models (Logistic, Poisson, etc.)
This video section gives excellent, clear guidance on how to choose the right GLM based on the nature of your outcome variable.
Please watch the segment from 12:37 to 16:57. The speaker provides decision rules for choosing between Logistic, Poisson, Negative Binomial, and Gamma models based on the characteristics of the outcome data.
Here's a summary of the key decision rules from the video:
- Response is a count (e.g., number of accidents, number of children): Use Poisson Regression.
- Response is a count with high variance (variance is much larger than the mean, a condition called overdispersion): Use Negative Binomial Regression.
- Response is continuous, positive, and skewed (e.g., insurance claim amounts, time to an event): Use Gamma Regression.
4. A Comprehensive Flowchart for Exam Day
The resource below contains a detailed flowchart that puts all these rules together into a single, comprehensive guide. It's an excellent tool to formalize your thinking.
Comprehensive guidelines for appropriate statistical analysis
This paper offers a comprehensive flowchart for selecting statistical methods. We will focus on the paths relevant to our course.
First, carefully examine 'Fig. 1. Flowchart for selecting the statistical analysis method'. Then, read the worked examples in the 'Results' section that show how to apply the flowchart, particularly the example leading to the chi-square test in 'Fig. 3'.
Let's trace the main paths on that flowchart:
- Start Diamond: "Type of RV" (Response Variable).
- Go Left (Categorical):
- Next Diamond: "NL(RV)" (Number of Levels in Response). If 2 (binary), you go down. If 3+, you go up.
- Next Diamond: "Type of EV" (Explanatory Variable). If it's categorical, you head toward Chi-Square/Fisher's. If it's quantitative or mixed, you head toward Logistic Regression. This perfectly matches our framework.
- Go Right (Quantitative):
- The chart primarily details tests for normally distributed data (t-test, ANOVA). For your exam, you should mentally add branches here: "Is the distribution Poisson (counts)?" -> Poisson GLM. "Is it Gamma (skewed, positive)?" -> Gamma GLM.
5. Practice Round: What's the Test?
Now, let's put your decision-making skills to the test. For each problem below, identify the response and predictor variables and then name the most appropriate statistical analysis. Don't solve them!
Problem 1:
A researcher wants to know if there is a relationship between a person's favorite season (Winter, Spring, Summer, Fall) and their preference for dogs or cats. They survey 300 people and create a 4x2 contingency table.
Click to reveal the answer
* **Response Variable:** Pet preference (Categorical, 2 levels: Dog, Cat). * **Predictor Variable:** Favorite season (Categorical, 4 levels). * **Goal:** Test for association between two categorical variables from a single sample. * **Appropriate Test:** **Pearson Chi-Square Test of Independence**. * **Justification:** We are testing for a relationship between two categorical variables. Since the sample size is large (300) and we can assume expected counts are >5, the Chi-square test is appropriate over Fisher's.Problem 2:
A public health study follows 40 people. 20 of them are smokers and 20 are non-smokers. The study records whether each person develops a particular respiratory illness within 10 years. The resulting 2x2 table has an expected cell count of 3.5.
Click to reveal the answer
* **Response Variable:** Respiratory illness (Categorical, 2 levels: Yes, No). * **Predictor Variable:** Smoking status (Categorical, 2 levels: Smoker, Non-smoker). * **Goal:** Compare proportions between two independent groups. * **Appropriate Test:** **Fisher's Exact Test**. * **Justification:** This is a test on a 2x2 contingency table. Although it could be framed as a test of homogeneity (comparing illness rates between smoker/non-smoker groups), the key information is that an expected cell count is less than 5. This violates the assumption of the Chi-Square test, making Fisher's Exact Test the correct choice.Problem 3:
A bank wants to create a model to predict whether a loan applicant will default on their loan (Yes/No). The predictors they want to use are the applicant's annual income (in dollars) and their credit score (a number from 300-850).
Click to reveal the answer
* **Response Variable:** Loan default (Categorical, 2 levels: Yes, No). * **Predictor Variables:** Annual income (Continuous), Credit score (Continuous). * **Goal:** Predict a binary outcome from continuous predictors. * **Appropriate Test:** **Binary Logistic Regression**. * **Justification:** The outcome is binary, and the goal is to build a predictive model using continuous explanatory variables. This is the classic use case for logistic regression.Problem 4:
A city's transportation department wants to model the number of daily bike-share rentals. They believe the number of rentals is influenced by the day's high temperature and whether it is a weekday or weekend.
Click to reveal the answer
* **Response Variable:** Number of daily rentals (Quantitative, count data). * **Predictor Variables:** High temperature (Continuous), Day type (Categorical: Weekday/Weekend). * **Goal:** Model a count outcome using multiple predictors. * **Appropriate Test:** **Poisson Regression** (or Negative Binomial Regression if the data is overdispersed). * **Justification:** The response variable is a count of events (rentals). This is the ideal scenario for a Poisson GLM.Problem 5:
An educational researcher wants to determine if the passing rate on a standardized test is the same across three different teaching methods (A, B, and C). They take three separate groups of 100 students, assign each group a different teaching method, and record who passed and failed.
Click to reveal the answer
* **Response Variable:** Test outcome (Categorical, 2 levels: Pass, Fail). * **Predictor Variable:** Teaching method (Categorical, 3 levels). * **Goal:** Compare proportions of a binary outcome across three independent groups. * **Appropriate Test:** **Chi-Square Test of Homogeneity**. * **Justification:** The study design involves three fixed, independent samples (the three groups of 100). The goal is to see if the distribution of the response (pass/fail rates) is homogeneous across these groups.Conclusion
You have reached the end of the course! In this final lesson, you've consolidated all your knowledge into a powerful, practical skill: quickly and accurately identifying the right statistical tool for a given problem.
Your Key Takeaways for the Exam:
- Start with the Response Variable: Is it categorical, a count, or continuous? This is your first and most important decision.
- Contingency Tables vs. Logistic Regression: For a categorical response, use contingency tables to test for association between categorical variables. Use logistic regression to build predictive models, especially with continuous predictors.
- Chi-Square vs. Exact Tests: Let the sample size and expected cell counts guide your choice. Small samples or low expected counts demand an exact test.
- Choosing a GLM: Let the nature of a quantitative response guide you. Counts suggest Poisson, and skewed positive data suggests Gamma.
You have put in the hard work to prepare. Trust the decision frameworks we've built, read the questions carefully, and apply the methods you've mastered.
Good luck with your midterm