Hello! In our last lesson, we established a clear decision framework for choosing between a contingency table analysis and a Generalized Linear Model (GLM). You learned to make this choice based on the number and types of variables and the overall goal of the analysis.
Now, let's drill down one level deeper. Once you've decided that a contingency table analysis is the right approach for your problem, you face another choice: which specific test should you use?
This lesson will focus on exactly that. Our learning outcome is to: For a contingency table problem, determine whether to use a chi-square test or an exact test based on sample size.
This is a critical skill for your exam, as it often comes down to a straightforward rule that you can apply quickly and confidently.
1. The Fundamental Difference: Approximation vs. Exact Calculation
The core reason for choosing between a Chi-square test and an exact test (like Fisher's Exact Test) lies in how they calculate the p-value.
-
The Pearson Chi-Square Test is an approximate test. It uses the chi-square statistic, , which follows a known theoretical chi-square distribution if the sample size is large enough. The p-value is an approximation based on this distribution. When the sample size is small, this approximation can be inaccurate.
-
Fisher's Exact Test is an exact test. As the name implies, it calculates the exact probability of observing the data (or more extreme data) under the null hypothesis, without relying on an approximation. This makes it reliable for any sample size, but it is especially crucial for small samples where the Chi-square test is invalid.
This short video provides a concise overview of this key difference.
Chi-Square and Fisher's Exact Test Explained
The following clip from GraphPad Software's video 'Chi-Square and Fisher's Exact Test Explained' clearly articulates the core distinction between the two tests.
Please watch from 01:36 to 02:12. Pay close attention to the distinction made between an 'exact p-value' and an 'approximation', and which test is better for small versus large samples.
The video highlights that Fisher's test is designed for small samples, while the Chi-square test is more accurate for large ones. But what qualifies as "small" or "large"? That brings us to our main decision rule.
2. The Core Decision Rule: Checking Expected Cell Counts
The most common and important rule for choosing between these tests is based on the expected cell frequencies in your contingency table. Recall from our earlier lessons that the expected count for a cell is the count we would expect to see if the two variables were perfectly independent.
The rule is simple and direct, making it perfect for an exam setting. To understand and apply it, please review the following resource.
Chi-Square and Fisher's Exact Test | Easy Guide - Biostat Prime
This guide from Biostat Prime, 'Chi-Square and Fisher's Exact Test', provides an excellent, practical summary of when to use each test. We will focus on the key decision rules it presents.
Please read the following sections from the webpage: In the section 'Chi-Square Test (χ² Test): Concept and Example', find the guideline starting with 'Use the Chi-Square Test if...'. In the section 'Fisher’s Exact Test – Concept and Example', read the first paragraph to see when this test is preferred. Study the table under 'Fisher's Exact Test vs Chi-Square – Key Differences'. Pay special attention to the rows for 'Sample Size' and 'Expected Frequency'. Finally, read the last FAQ question at the bottom of the page that begins, 'The choice between Chi-Square and Fisher's Exact Test...'
From these sections, we can establish a clear, primary decision rule:
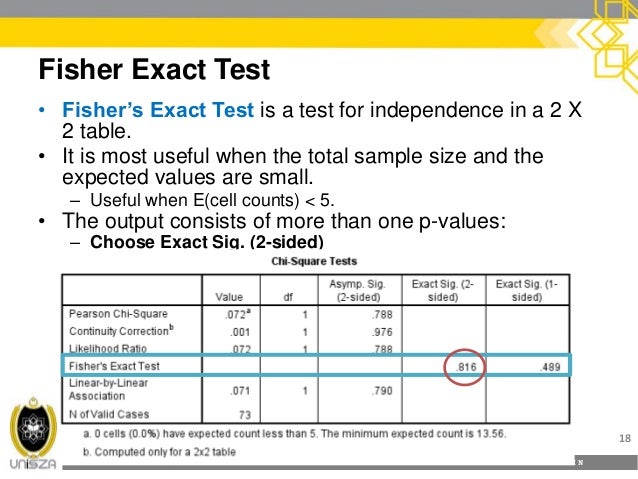
If any cell in your contingency table has an expected frequency of less than 5, you should use Fisher's Exact Test.
If all expected cell frequencies are 5 or greater, the Pearson Chi-square test is generally considered valid and appropriate.
The image below provides a great visual summary of this rule and shows where you would typically find the result for Fisher's Exact Test in statistical software output.
3. A More Formal Guideline: Cochran's Rule
While the "less than 5" rule is a widely used and safe guideline for exams, you might occasionally see a slightly more lenient version known as Cochran's Rule. It's useful to be aware of this, as it provides a more nuanced understanding of the Chi-square test's limits.
The following resource provides this more formal guideline.
Statistical notes for clinical researchers: Chi-squared test and ... - PMC
This research paper from the journal 'Restorative Dentistry & Endodontics' provides the formal statistical requirements for the chi-squared test.
Please read two brief passages: At the end of the section '1. Independency test', read the final paragraph that begins 'The chi-squared test needs an adequate large sample size...'. In the following section, 'Fisher's exact test', read the first two sentences to see how this rule directly leads to the choice of Fisher's test.
This resource formalizes the rule as follows: The Chi-square test is considered valid if:
- No more than 20% of the cells have an expected frequency less than 5.
- No cell has an expected frequency less than 1 (or 0).
If your table violates this condition (e.g., in a 2x2 table, if one cell has an expected count < 5, that's 25% of the cells), then Fisher's Exact Test is required.
Exam Strategy: For your exam, stick to the simpler and stricter rule: If you find any expected cell count less than 5, choose Fisher's Exact Test. This is the safest and most commonly applied version of the rule.
4. A Worked Decision Example
Let's apply this logic to two quick scenarios.
Scenario A: Large Sample
A study looks at the association between taking a Vitamin C supplement (Yes/No) and catching a cold (Yes/No). The observed data is:
| Cold: Yes | Cold: No | Total | |
|---|---|---|---|
| Vitamin C: Yes | 15 | 85 | 100 |
| Vitamin C: No | 25 | 75 | 100 |
| Total | 40 | 160 | 200 |
To decide on a test, we calculate the expected frequencies. For the top-left cell (Vitamin C: Yes, Cold: Yes), the expected count is:
If you calculate the other three expected counts, you will find they are 80, 20, and 80, respectively.
- Analysis: All expected counts are well above 5.
- Decision: The Chi-square test is appropriate.
Scenario B: Small Sample
A pilot study on a new drug examines if it causes a rare side effect.
| Side Effect: Yes | Side Effect: No | Total | |
|---|---|---|---|
| Drug: Yes | 3 | 7 | 10 |
| Drug: No | 0 | 10 | 10 |
| Total | 3 | 17 | 20 |
Let's calculate the expected count for the top-left cell (Drug: Yes, Side Effect: Yes):
- Analysis: We immediately found an expected count (1.5) that is less than 5. We don't need to calculate the rest.
- Decision: We must use Fisher's Exact Test.
Conclusion
You have now learned the crucial decision rule that separates the use of the Chi-square test from Fisher's Exact Test. This is a common point of testing in exams because it demonstrates your understanding of the assumptions behind these fundamental statistical methods.
Key Takeaways:
- The choice between a Chi-square test and an exact test hinges on the validity of the Chi-square approximation, which depends on sample size.
- The practical way to check this is by calculating the expected cell frequencies.
- Your Decision Rule: If any expected cell frequency is less than 5, you must use an exact test (Fisher's Exact Test). If all expected frequencies are 5 or greater, the Pearson Chi-square test is valid.
Preview of the Next Lesson:
In our previous lesson, you learned how to choose between a contingency table analysis and a GLM. In this lesson, you learned which contingency table test to use. In our next lesson, we will put it all together by tackling a complete application problem. You will be given a scenario and will be expected to perform the full analysis, from setting up the table and choosing the correct test to calculating the test statistic and drawing a final conclusion.