Introduction
Welcome to your first lesson in calculus! Given your ambition to excel in the JEE Advanced and your strong foundation in physics, we'll build your understanding of calculus from the ground up, focusing on the core intuition behind each concept. This course is designed to give you that deep, "mental picture" understanding you're looking for, which is the key to solving unconventional problems.
Today, we begin with the absolute bedrock of calculus: the concept of a limit. You've likely encountered the idea in passing, but our goal here is to develop a solid, intuitive grasp of what limits are and why they are so crucial. We'll explore this idea by looking at graphs and playing with numbers, answering the question: How can we predict a function's behavior at a point we can't directly calculate? This concept is the gateway to understanding rates of change (derivatives) and accumulation (integrals), which are fundamental tools in both mathematics and physics.
What is a Limit? A Prediction Game
Before diving into formal mathematics, let's start with a simple, powerful idea. A limit is essentially a prediction. It's our best guess for a function's value at a specific point, made by looking at the values at all the neighboring points.
The article "An Intuitive Introduction To Limits" from BetterExplained provides an excellent starting point for this idea.
An Intuitive Introduction To Limits – BetterExplained
This reading introduces the core idea of a limit as a "prediction" and uses a non-mathematical analogy to build intuition. It's a perfect way to start thinking about the concept before we add in the numbers and graphs.
Please read the first few sections, starting from the beginning, down to the end of the "Key Analogy: Predicting A Soccer Ball" section. As you read, focus on these two points: Why do we need to make a "prediction" in the first place? What are the "black hole" scenarios in math? What makes a prediction "confident"? Think about the two conditions mentioned: agreement at increasing zoom levels and agreement from before and after.
The soccer ball analogy is a great way to visualize this. If the video feed cuts out at exactly 4:00, you can still make a very accurate prediction of the ball's position by looking at where it was at 3:59.99 and 4:00.01. The core idea is that for most well-behaved physical phenomena (and mathematical functions), things don't teleport. They move smoothly from one point to the next.
A limit is the mathematical formalization of this prediction. We ask, "If we zoom in infinitely close to a point from both sides, does our prediction for the function's value hold up and narrow down to a single, unambiguous number?"
This idea has deep roots. Think of Archimedes trying to find the circumference of a circle. He couldn't measure the curved line directly, so he approximated it by inscribing and circumscribing polygons with more and more sides.

In essence, Archimedes was predicting the circle's circumference by getting infinitely close to it with shapes he could measure.
Exploring Limits Numerically and Graphically
Let's make this more concrete with a function. Consider this:
What is the value of ? If we try to plug in , we get , which is undefined. This is one of those "black hole" scenarios. We can't directly calculate the value at . But can we predict it? Let's investigate what happens near .
The resource "Calculus I - The Limit" from Paul's Online Math Notes provides a clear walkthrough of this numerical exploration.
This section will show you how to use a table of values to "zoom in" on a point and estimate a limit.
Read through Example 1. Focus on the table of values showing f(x) as x gets closer to 2 from both the left (1.9, 1.99, etc.) and the right (2.1, 2.01, etc.). Notice the trend in the f(x) column.
As you can see from the table, as we pick values of closer and closer to 2, the value of gets closer and closer to 4. This suggests our prediction, or limit, is 4. We write this using the following notation:
This notation reads: "The limit of the function as approaches 2 is 4."
A graph gives us a powerful visual for what's happening.
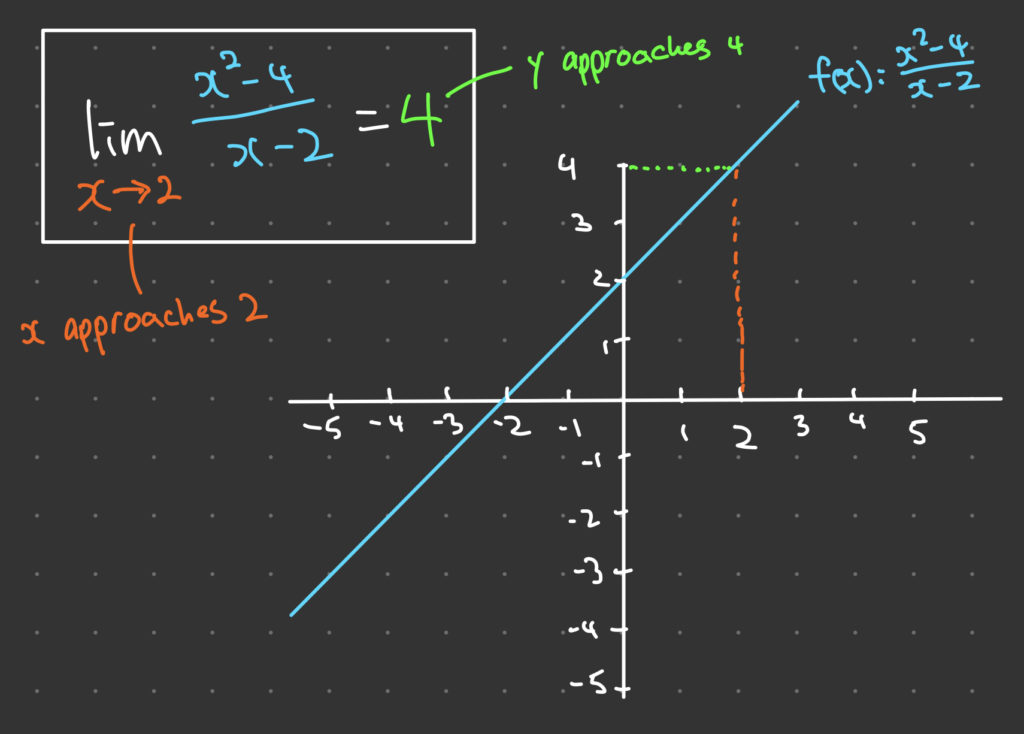
This leads to the most important takeaway of this lesson: The limit at a point does not care about the function's actual value at that point. It is only concerned with what the function is doing around that point.
To really drive this home, let's watch how Sal Khan from Khan Academy explains this. He uses two excellent examples, one with a "hole" and another with a "displaced point" (a piecewise function).
Introduction to limits | Limits | Differential Calculus | Khan Academy
These two examples perfectly illustrate the core concept: a limit is about the approach, not the destination.
Watch the first example where he discusses a function with a hole in the graph. This is very similar to the function we just analyzed. Then, watch the piecewise function example. This one is crucial. Pay close attention to the difference between the value of the limit as x approaches 2 and the actual value of the function at x=2. He also uses a calculator to demonstrate the numerical approach, which you should find familiar.
When Do Limits Fail to Exist?
So far, we've successfully made a prediction. But what if we can't? A limit does not exist if there isn't one single, unambiguous value that the function is heading towards. Let's look at two common ways this can happen.
Again, we'll turn to the clear examples in Paul's Online Math Notes.
These two examples illustrate cases where a limit does not exist, which is just as important as knowing when one does.
Skim Example 4, which discusses the function \cos(\pi/t) as t \to 0. Look at the graph. Notice how the function oscillates more and more wildly as it approaches 0. It never settles down to a single value. Next, read Example 5, which looks at the Heaviside (or step) function. Look at its graph. What happens as you approach t=0 from the left side versus the right side?
These two examples show the main reasons a limit might not exist:
- Infinite Oscillation: The function fluctuates so wildly near the point that it never approaches a single number.
- A Jump: The function approaches one value from the left side and a different value from the right side. Since there's no single, agreed-upon prediction, the overall limit doesn't exist.
The video from The Organic Chemistry Tutor provides a great graphical summary of these ideas.
Calculus 1 - Introduction to Limits
This video offers a concise graphical tour of how to find limits and identify when they don't exist.
Watch the segment on evaluating limits graphically. The presenter walks through several graphs, including ones with "jumps." This will introduce you to the idea of approaching from the left vs. the right, which is a key theme for our next lesson.
Conclusion
In this introductory lesson, we've built the foundational intuition for limits. The key is to think of a limit as a well-supported prediction about a function's behavior at a point, based on its behavior in the immediate neighborhood.
Here are the main takeaways:
- A limit is the value a function approaches as its input gets closer and closer to a certain point.
- We can investigate limits numerically by creating a table of values or graphically by observing the y-value the function's graph heads towards.
- Crucially, the limit of a function as is independent of the function's actual value at . It's all about the journey, not the destination.
- A limit does not exist if the function doesn't approach a single, finite value. This can happen if it oscillates infinitely or if it "jumps" to different values from the left and right.
This last point is where we will pick up next time. We will formalize the concept of approaching from the left and right by defining one-sided limits. This will give us a rigorous way to determine whether a two-sided limit (the kind we've discussed today) truly exists.