Hello! Welcome to your next lesson.
In our last session, you learned how to merge disparate datasets using both attribute and spatial joins. This skill allows you to create rich, comprehensive datasets by combining, for example, child welfare case data with neighborhood-level demographic data from the census. This is a fundamental step in building the analytical files needed for policy evaluation.
Today, we'll tackle the next critical data preparation step: reshaping panel data from a wide to a long format. Your goal is to perform longitudinal analysis—to study how indicators change over time. The data format you use is crucial for this. This lesson will equip you with the skills to structure your data correctly, setting the stage for the time-series and policy evaluation techniques we'll cover later in the course.
We'll cover:
- The difference between "wide" and "long" data formats and why long format is preferred for longitudinal analysis.
- How to use the
pandas.melt()function to perform a basic wide-to-long transformation. - How to use the more specialized
pandas.wide_to_long()function for complex panel data with multiple time-varying indicators.
1. Wide vs. Long Data: What and Why?
When you work with panel data—where you observe the same entities (like counties or children) at multiple points in time—the data can be structured in two primary ways.
- Wide Format: Each entity has a single row, and measurements from different time points are in separate columns. For example, you might have columns like
placements_2020,placements_2021, andplacements_2022. - Long Format: Each row represents one observation of one entity at one point in time. You would have a column for the entity identifier (e.g.,
county_fips), a column for the time period (e.g.,year), and a column for the value (e.g.,placements).
Reshape Panel Data from Wide to Long
This article from 'Learning Online Statistics' provides an excellent, clear definition of wide and long formats with simple tables that make the distinction obvious. It's a great starting point to solidify the concept.
Read the introductory section, focusing on the two example tables that illustrate the wide and long formats. Note the explanation that long format is easier for running models like fixed effects, which is a key technique in policy analysis.
For most analytical tasks in Python, the long format is strongly preferred. It's more flexible and works seamlessly with libraries like statsmodels for regression and seaborn for plotting. Imagine trying to plot a time trend of placements across 10 years in wide format; you'd be wrestling with 10 different columns. In long format, you can simply plot the placements column against the year column.
This structure also aligns with the concept of "tidy data," where each variable forms a column, each observation forms a row, and each type of observational unit forms a table.
2. Reshaping with pandas.melt()
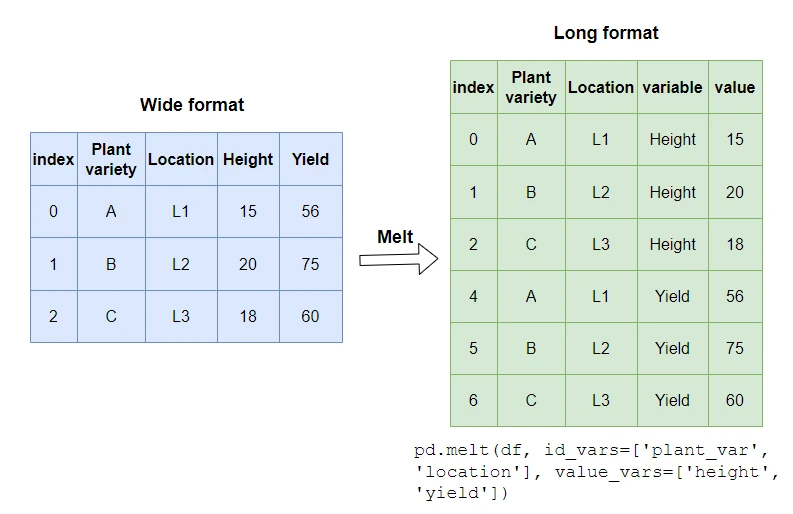
The primary tool for converting data from wide to long format in pandas is the .melt() function. It "unpivots" a DataFrame from a wide format to a long format.
Let's look at how it works.
Basic Melting
To see melt() in action, let's watch a quick tutorial.
Python Pandas Tutorial 11. Reshape dataframe using melt
This Codebasics video provides a very clear, step-by-step introduction to the melt function using a simple weather dataset.
Watch the video up to the 4:33 mark. Pay close attention to these key arguments: id_vars: The column(s) you want to keep as identifiers (e.g., 'day' in the video). var_name: The name for the new column that will hold the headers of the unpivoted columns (e.g., 'city'). value_name: The name for the new column that will hold the values.
As you saw, the basic syntax looks like this:
import pandas as pd


# Example wide-format DataFrame
df_wide = pd.DataFrame({
    'day': ['Monday', 'Tuesday', 'Wednesday'],
    'new_york': [32, 28, 30],
    'chicago': [25, 22, 27]
})

df_long = pd.melt(df_wide,
                  id_vars=['day'],
                  var_name='city',
                  value_name='temperature')

print(df_long)
Output:
         day        city  temperature
0     Monday    new_york           32
1    Tuesday    new_york           28
2  Wednesday    new_york           30
3     Monday     chicago           25
4    Tuesday     chicago           22
5  Wednesday   chicago           27
Melting with Multiple Identifier Variables
In policy data, you often have multiple identifier variables, such as state_fips, county_fips, and year. You can pass a list of these columns to id_vars to keep them all fixed.
What does "melt" do in Pandas?
This video from Reuven Lerner uses a more complex dataset to demonstrate melting with multiple identifiers and selecting specific columns to melt.
Watch the segment from 4:11 to 6:18. Notice how id_vars can take a list of columns (['year', 'state_code']) to preserve the unique identity of each observation group.
This is essential for your work, as you'll often need to preserve geographic identifiers alongside a time variable.
3. A More Complex Scenario: pandas.wide_to_long()
The melt() function is great, but it can be cumbersome when your wide-format data has multiple time-varying indicators. Consider a dataset from your previous lesson, where you merged AFCARS placement data with ACS poverty data. A wide version might look like this:
# A realistic wide-format child welfare dataset
data = {
    'county_fips': ['01001', '01003'],
    'county_name': ['Autauga County', 'Baldwin County'],
    'placements_2020': [50, 75],
    'poverty_rate_2020': [12.1, 15.3],
    'placements_2021': [55, 72],
    'poverty_rate_2021': [11.8, 15.5]
}
df_wide_complex = pd.DataFrame(data)

print(df_wide_complex)
Output:
  county_fips   county_name  placements_2020  poverty_rate_2020  placements_2021  poverty_rate_2021
0       01001  Autauga County               50               12.1               55               11.8
1       01003  Baldwin County               75               15.3               72               15.5
Here, we have two indicators (placements and poverty_rate) that both vary over time. While you could melt this, it would require multiple steps. A more direct tool is pandas.wide_to_long(). This function is designed for exactly this kind of structured naming convention (e.g., variable_year).
The key parameters for wide_to_long() are:
df: The DataFrame to reshape.stubnames: A list of the "stubs" of the variable names (e.g.,['placements', 'poverty_rate']).pandaswill look for columns that start with these stubs.i: The column(s) that identify the entities (similar toid_vars).j: The name for the new time-period column (e.g.,year).sep: The character that separates the stub from the time value in the column name (e.g.,_).
Here is how you would use it on our complex example:
# First, rename columns to have the year *before* the stub
# wide_to_long expects format like 'placements_2020', not '2020_placements'
# Let's adjust our thinking: often data comes as 'stubYEAR', e.g., 'placements2020'
# Let's recreate our dataframe to match the more common stub-first format
data = {
    'county_fips': ['01001', '01003'],
    'county_name': ['Autauga County', 'Baldwin County'],
    'placements_2020': [50, 75],
    'poverty_rate_2020': [12.1, 15.3],
    'placements_2021': [55, 72],
    'poverty_rate_2021': [11.8, 15.5]
}
df_wide_complex = pd.DataFrame(data)


df_long_complex = pd.wide_to_long(
    df_wide_complex,
    stubnames=['placements', 'poverty_rate'],
    i=['county_fips', 'county_name'],
    j='year',
    sep='_'
).reset_index()

print(df_long_complex)
Output:
  county_fips   county_name  year  placements  poverty_rate
0       01001  Autauga County  2020          50          12.1
1       01001  Autauga County  2021          55          11.8
2       01003  Baldwin County  2020          75          15.3
3       01003  Baldwin County  2021          72          15.5
As you can see, wide_to_long efficiently transformed the data, creating separate columns for each of the time-varying indicators, perfectly structured for longitudinal analysis.
Reshape Panel Data from Wide to Long
The same 'LOST-stats' article also provides a code example using wide_to_long. Reviewing this will reinforce what you've just seen.
Read the 'Python' implementation section. Compare the code for wide_to_long and melt. Notice how wide_to_long is more concise for this specific structure.
The Payoff: What Long Format Enables
Now that your data is in long format, what can you do? This structure unlocks a powerful set of analytical techniques within pandas. For example, you can now easily use groupby() on your county identifiers to calculate changes over time or create lagged variables.
Working With Hierarchical Data in Long Form
This article on hierarchical data provides excellent examples of analyses that are simple to perform once your data is in long format.
Briefly scan the section 'Variables Based On An Observations Neighbors'. You don't need to memorize the code, but appreciate how the .shift() function, used within a groupby('id'), can create a 'previous year's income' variable. This is a foundational technique for difference-in-differences and other causal models you'll learn later.
Conclusion
In this lesson, you've learned one of the most important data wrangling skills for longitudinal policy analysis. Transforming your data from wide to long format is the final, crucial step in preparing your data for modeling change over time.
Key Takeaways:
- Long format is the standard for longitudinal analysis in Python, making it easier to plot, model, and analyze data over time.
pandas.melt()is the general-purpose tool for unpivoting data, ideal for simpler cases with one measured variable. You control it withid_vars,var_name, andvalue_name.pandas.wide_to_long()is a powerful, specialized tool for when you have multiple time-varying indicators with a consistent naming scheme (e.g.,variable_year).
With your data now cleaned, merged, and properly shaped, you are ready to begin the analysis. In the next module, we will dive into Exploratory Analysis of Child Welfare Disparities. You'll start by using your long-format data to compute key child welfare indicators and generate summary statistics to identify patterns and disparities.