Hello! Welcome to your next lesson.
In our previous session, we focused on structuring data for longitudinal analysis by reshaping it from wide to long format. This was the final step in getting our data into the right shape. Now, we must address its completeness.
Today's lesson addresses a universal challenge in data analysis, especially when using administrative data from government agencies: missing values. Your ability to thoughtfully handle missing data is crucial for producing credible and robust policy analysis. The learning outcome for this lesson is to apply and justify strategies for handling missing data in child welfare records.
We will cover:
- How to identify both standard and non-standard missing values in a dataset using
pandas. - Simple strategies for handling missing data: deletion and single value imputation.
- More advanced, model-based strategies like Multiple Imputation by Chained Equations (MICE).
- How to justify your choice of strategy in the context of child welfare policy analysis.
As we go, we'll draw on insights from real-world research to understand the specific missing data challenges in the child welfare domain.
1. The Challenge of Missing Data in Child Welfare Records
Missing data isn't just a technical nuisance; it's a reflection of real-world processes. In administrative datasets like AFCARS or NCANDS, data might be missing for many reasons: a field was optional, a record was expunged due to policy, a data system was updated, or there were simple data entry errors.
Handling this incorrectly can introduce significant bias. For example, if data on foster care placements is more likely to be missing from under-resourced rural counties, simply dropping those records could make your analysis systematically biased against the experiences of children in rural areas.
Problems and solutions in accessing administrative child welfare data
This research paper provides a real-world account of the challenges in using administrative child welfare data from multiple states. It's a great resource for understanding the why behind the techniques we'll learn.
Skim through sections 4.1 ('Availability of historical data') and 6 ('Operationalizing and coding child welfare variables'). You don't need to read in detail, but notice the descriptions of how data availability and definitions vary across states. For instance, see how the researchers had to create decision rules for 'allegation types' (Table 1) or 'perpetrator types' (Table 2) because of inconsistent coding. This is a form of 'messy' data that often leads to missing values.
The paper highlights that dealing with missing data starts with understanding it. It's not just about finding NaN values; it's about identifying inconsistencies and making principled decisions on how to harmonize them, which can itself create missingness that must then be handled.
2. Identifying and Handling Missing Data with pandas
Let's turn to the practical side. We'll use the pandas library to find and handle missing data. The most common representation of a missing value is NumPy's np.nan (Not a Number).
This video provides an excellent, hands-on walkthrough of the essential pandas functions.
Python Pandas Tutorial (Part 9): Cleaning Data - Casting Datatypes and Handling Missing Values
Corey Schafer's tutorial is a clear and practical guide to the fundamental tools for handling missing data in pandas.
Please watch the following segments: Custom Missing Values (9:48 - 12:42): Pay attention to how he first identifies custom missing strings ('NA', 'missing') and then uses .replace() to convert them to np.nan. Also note the alternative of using the na_values parameter when loading a CSV. Inspecting with isna() (12:42 - 13:28): This shows how to get a boolean mask of your DataFrame to see where missing values are. Casting Data Types (14:59 - 19:43): This is a critical section. Note why a column with np.nan values cannot be an integer type and must be cast to a float. Real-World Example (19:43 - 28:53): This part is highly relevant. He encounters a column ('YearsCode') that should be numeric but contains strings ('Less than one year'). He identifies the unique values, replaces the strings with numbers, and then successfully converts the column to a numeric type to calculate the mean. This is a perfect analogy for cleaning messy administrative data fields.
As you saw in the video, the first step is often a clean-up pass to ensure all missing or non-standard values are represented as np.nan. Here’s a summary of that workflow:
- Load Data: When possible, use
na_valuesinpd.read_csv()to automatically convert custom missing strings tonp.nan.missing_formats = ['N/A', 'Not Reported', -99] df = pd.read_csv('your_data.csv', na_values=missing_formats) - Inspect: Use
df.isna().sum()to get a count of missing values in each column. - Clean and Replace: For values not caught on import, use
.replace()to standardize them, then cast the column to the appropriate data type.# Example inspired by the video and child welfare data # Let's say a 'placement_type' column has inconsistent codes # We decide to treat 'Unknown' and 'Other' as missing for our analysis df['placement_type'].replace(['Unknown', 'Other'], np.nan, inplace=True) # Example of numeric cleaning df['days_in_care'].replace('Less than a week', 3.5, inplace=True) # Approximate df['days_in_care'] = df['days_in_care'].astype(float) # Cast to float
3. Core Strategies: Deletion and Imputation
Once missing values are identified, you must decide what to do with them. The flowchart below shows a systematic way to think about the process.

The two simplest strategies are deleting the data or filling it with a single value.
Strategy 1: Deletion (Complete-Case Analysis)
This involves removing rows or columns that contain missing data.
- How: Use the
df.dropna()method. - When to Justify: This is only appropriate if the amount of missing data is very small and you can confidently assume the data is Missing Completely at Random (MCAR). MCAR means the fact that the data is missing has no relationship to any other data. For example, if a data entry form was smudged, causing a few random entries to be lost.
- The Risk: As the next video explains, this is rarely a safe assumption in social policy data. If missingness is systematic (e.g., related to geography, case complexity, or family income), dropping records will bias your sample and lead to incorrect conclusions.
Imputation Methods for Missing Data
This video from Sundog Education explains the conceptual pros and cons of different imputation strategies.
Watch the segment on dropping data (2:28 - 4:37). The key takeaway is the discussion of bias. The example of high/low income earners being more likely to not report income is directly analogous to challenges in child welfare data.
Strategy 2: Single Imputation
This involves filling in missing values with a single, plausible value.
- How: Use the
df.fillna()method. - Common Choices:
- Mean/Median: For numeric data. The median is generally preferred for skewed distributions, which are common in policy data (e.g., length of stay in foster care, income).
- Mode: For categorical data (filling with the most frequent category).
- Constant: Filling with a specific value like 0 or a string like "Unknown". This is useful when the missingness itself is meaningful.
Imputation Methods for Missing Data
Let's return to the Sundog Education video to understand the trade-offs of this approach.
Watch the segment on mean replacement (0:10 - 2:28). Note the pros (fast, easy) and the major cons: it doesn't capture relationships between variables and it artificially reduces the variance of your data, which can make statistical tests misleading.
Single imputation is better than listwise deletion because it preserves your sample size, but it should be used with caution. It can distort the statistical properties of your dataset by understating variability and weakening correlations.
4. An Advanced Strategy: Multiple Imputation
Simple imputation methods fail to account for the uncertainty associated with the missing values. We don't know the true value, so just picking one (like the mean) is a bit too certain. Multiple imputation addresses this.
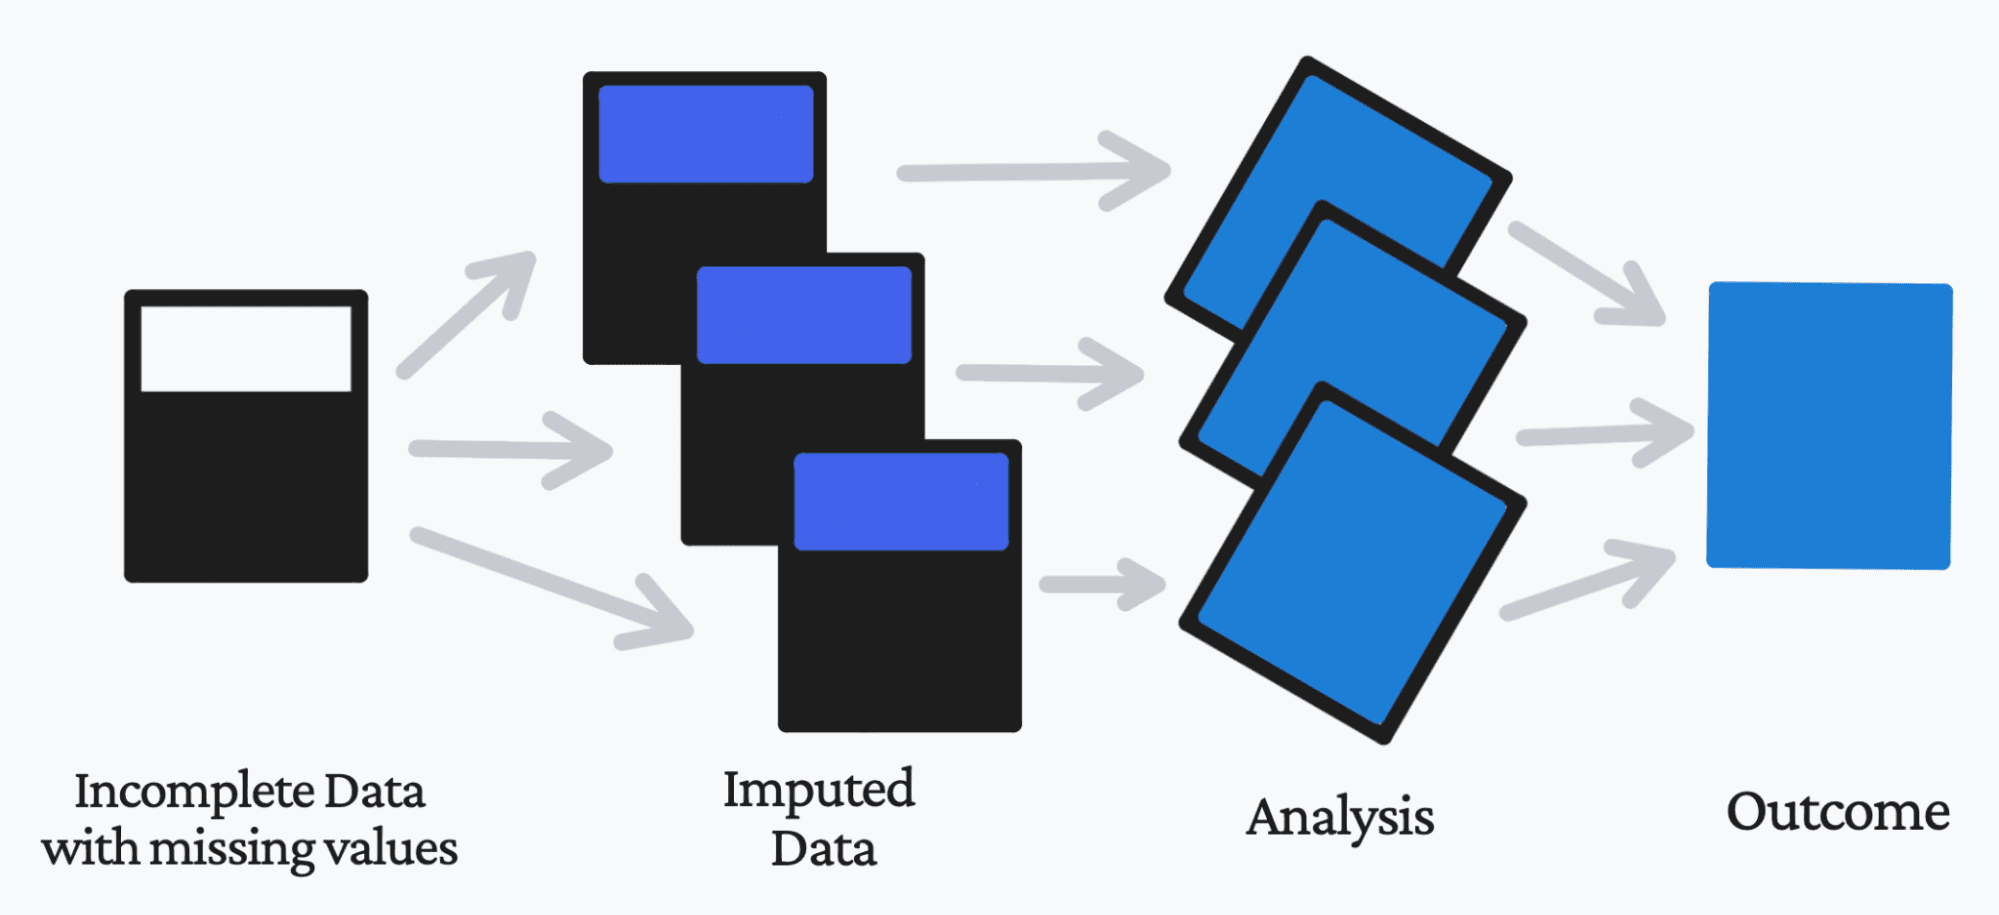
Multivariate Imputation by Chained Equations (MICE) is a popular and powerful multiple imputation method.
- The Idea: Instead of just using the column mean, MICE builds a regression model for each variable with missing data. It uses the other variables in the dataset as predictors to make an informed "guess" for the missing value.
- The Process: It iterates through the dataset, predicting and filling missing values for one variable at a time, and then repeats this process. This "chained" approach allows it to capture complex relationships and correlations in your data.
- The Benefit: By creating multiple imputed datasets, it allows you to see how sensitive your results are to the imputation and provides more accurate estimates of uncertainty (like standard errors in a regression model).
The Turing Way project provides a clear, non-technical explanation of MICE and a Python code example.
First, read the 'Imputation' section for a definition of single vs. multiple imputation. Then, read the 'MICE' section for a conceptual overview of how the algorithm works. Finally, review the Python code example under the 'Using MICE in python' heading. Notice that it uses IterativeImputer from scikit-learn.
Here's how you might apply IterativeImputer in Python. Note that it's still considered an "experimental" feature in scikit-learn, so you need to explicitly enable it first.
import pandas as pd
import numpy as np


# Sample data with missing values
data = {'county_fips': ['01001', '01003', '01005', '01007'],
        'poverty_rate': [12.1, 15.3, np.nan, 25.0],
        'placement_rate': [5.2, np.nan, 8.9, 10.1]}
df = pd.DataFrame(data).set_index('county_fips')


# Import and enable the imputer
from sklearn.experimental import enable_iterative_imputer
from sklearn.impute import IterativeImputer


# Initialize the imputer
# It will create 5 different imputed datasets (n_nearest_features is not a MICE parameter, sample_posterior is)
# Let's use a simple version for demonstration
imputer = IterativeImputer(max_iter=10, random_state=0)


# Fit and transform the data
imputed_data = imputer.fit_transform(df)


# The output is a NumPy array, so convert it back to a DataFrame
df_imputed = pd.DataFrame(imputed_data, columns=df.columns, index=df.index)

print("Original Data:")
print(df)
print("\nImputed Data:")
print(df_imputed)
This approach is particularly powerful when you believe the data is Missing at Random (MAR), meaning the missingness can be explained by other observed variables in your dataset.
Conclusion
You now have a toolkit of strategies for handling missing data, from simple to advanced. Choosing the right one requires careful justification based on your data and your research goals.
Key Takeaways:
- Identification is Key: Missing data in administrative records is often hidden in non-standard formats. Your first step is always to explore and standardize these values to
np.nan. - Deletion is Risky:
dropna()should only be used for small amounts of truly random missing data. In policy analysis, it's likely to introduce bias. - Single Imputation is a Compromise:
fillna()with the mean, median, or mode preserves your data but distorts its statistical properties. It can be a reasonable choice for exploratory analysis but is less ideal for final modeling. - Multiple Imputation is Robust: MICE (via
IterativeImputer) is a superior method for statistical modeling because it preserves relationships between variables and accounts for the uncertainty of imputation. - Justification is Everything: There is no single "best" method. As a policy analyst, your report must include a section justifying your chosen strategy. You should explain why you believe the data is missing (e.g., MAR), what method you chose, and what its limitations are. As the child welfare paper (LINK) showed, sometimes the most honest approach is to acknowledge that certain data (like unsubstantiated reports) is systematically missing and limit the scope of your analysis accordingly.
In our next module, we will begin our Exploratory Analysis of Child Welfare Disparities. The first step will be computing key indicators from your now-cleaned, merged, and properly shaped data. The careful work you've done in this module to prepare the data is the essential foundation for all the analysis that follows.