Welcome back. In the past several lessons, you have built a solid foundation in unsupervised clustering by individually exploring K-Means, Hierarchical Clustering, and DBSCAN. You've learned the mechanics of each and have even applied them in Python. Now, it's time to bring these concepts together.
This lesson focuses on the crucial skill of algorithm selection. Your goal is to learn how to compare these three fundamental clustering methods and, more importantly, to develop a framework for deciding which algorithm is best suited for a given dataset and problem. We will analyze their theoretical differences, compare their performance visually on various datasets, and synthesize this knowledge into a practical guide for making informed decisions as a data scientist.
A Head-to-Head Comparison of Clustering Algorithms
At a high level, the three algorithms you've learned represent different philosophies for finding groups in data:
- K-Means: A centroid-based approach that partitions data into a pre-specified number of spherical clusters.
- Hierarchical Clustering: A connectivity-based approach that builds a tree of nested clusters, either bottom-up (agglomerative) or top-down (divisive).
- DBSCAN: A density-based approach that groups together closely packed points, marking outliers as noise.
Understanding their core differences in handling parameters, cluster shapes, noise, and scalability is key to choosing the right tool for the job. The article "Comparing DBSCAN, k-means, and Hierarchical Clustering" provides an excellent and concise summary of these trade-offs.
When and Why To Choose Density-Based Methods - Hex
This article from the Hex tech blog clearly breaks down the comparison into five critical aspects. As you read, think about how these differences would influence your choice of algorithm in a real-world project.
Please read the section Comparing the Methods. Pay close attention to the tables and text in the subsections: Input Parameters: Note how the nature of the required inputs differs. K-Means needs the number of clusters, while DBSCAN needs parameters that define density. Shape of Clusters: This is a major differentiator. Contrast K-Means' assumption of spherical clusters with DBSCAN's flexibility. Handling of Noise and Outliers: Focus on DBSCAN's unique ability to explicitly identify noise, a significant advantage over K-Means. Scalability: Understand the computational complexity trade-offs, particularly why hierarchical clustering is often impractical for large datasets. Determining the Number of Clusters: Compare how k is a strict input for K-Means, a choice made by interpreting a dendrogram in hierarchical clustering, and an emergent property in DBSCAN.
The video "4 Clustering Model Algorithms in Python" by Grab N Go Info offers a great visual summary of these pros and cons and presents a helpful decision flowchart.
4 Clustering Model Algorithms in Python and Which is the Best | Machine Learning
This video provides a rapid review of the algorithms and a useful visual guide for selecting one.
You can skim through the individual explanations for a quick recap, but focus your attention on these two parts: First, watch the summary of the algorithm selection process. The diagram presented here provides an excellent mental model for choosing an algorithm based on cluster shape and density. Next, briefly review the pros and cons listed for K-Means, Hierarchical Clustering, and DBSCAN. This will help solidify the points from the reading.
Visualizing the Differences
Theoretical comparisons are essential, but seeing the algorithms perform on different datasets provides a much deeper intuition. Let's look at how their underlying assumptions lead to dramatically different results.

Observe the image "Clustering Algorithm Comparison on Basic Shapes" above.
- Top Row (Spherical Clusters): All three algorithms perform reasonably well. K-Means is perfectly suited for this, and both Hierarchical and DBSCAN also successfully identify the three distinct groups.
- Bottom Row (Concentric Rings): This is where the differences become stark. K-Means, trying to find spherical centers, fails completely by splitting the rings vertically. Hierarchical clustering (likely using a linkage like 'ward' or 'complete' which prefers compact clusters) also fails, creating two semi-circular groups. DBSCAN, however, excels. Because it defines clusters based on density and reachability, it correctly identifies the inner ring, the outer ring, and a few noise points.
This simple example powerfully illustrates a core principle: if your data's structure doesn't match an algorithm's assumptions, the results will be poor.
Now, let's examine a more comprehensive comparison from the scikit-learn documentation, which tests multiple algorithms on a variety of data structures.
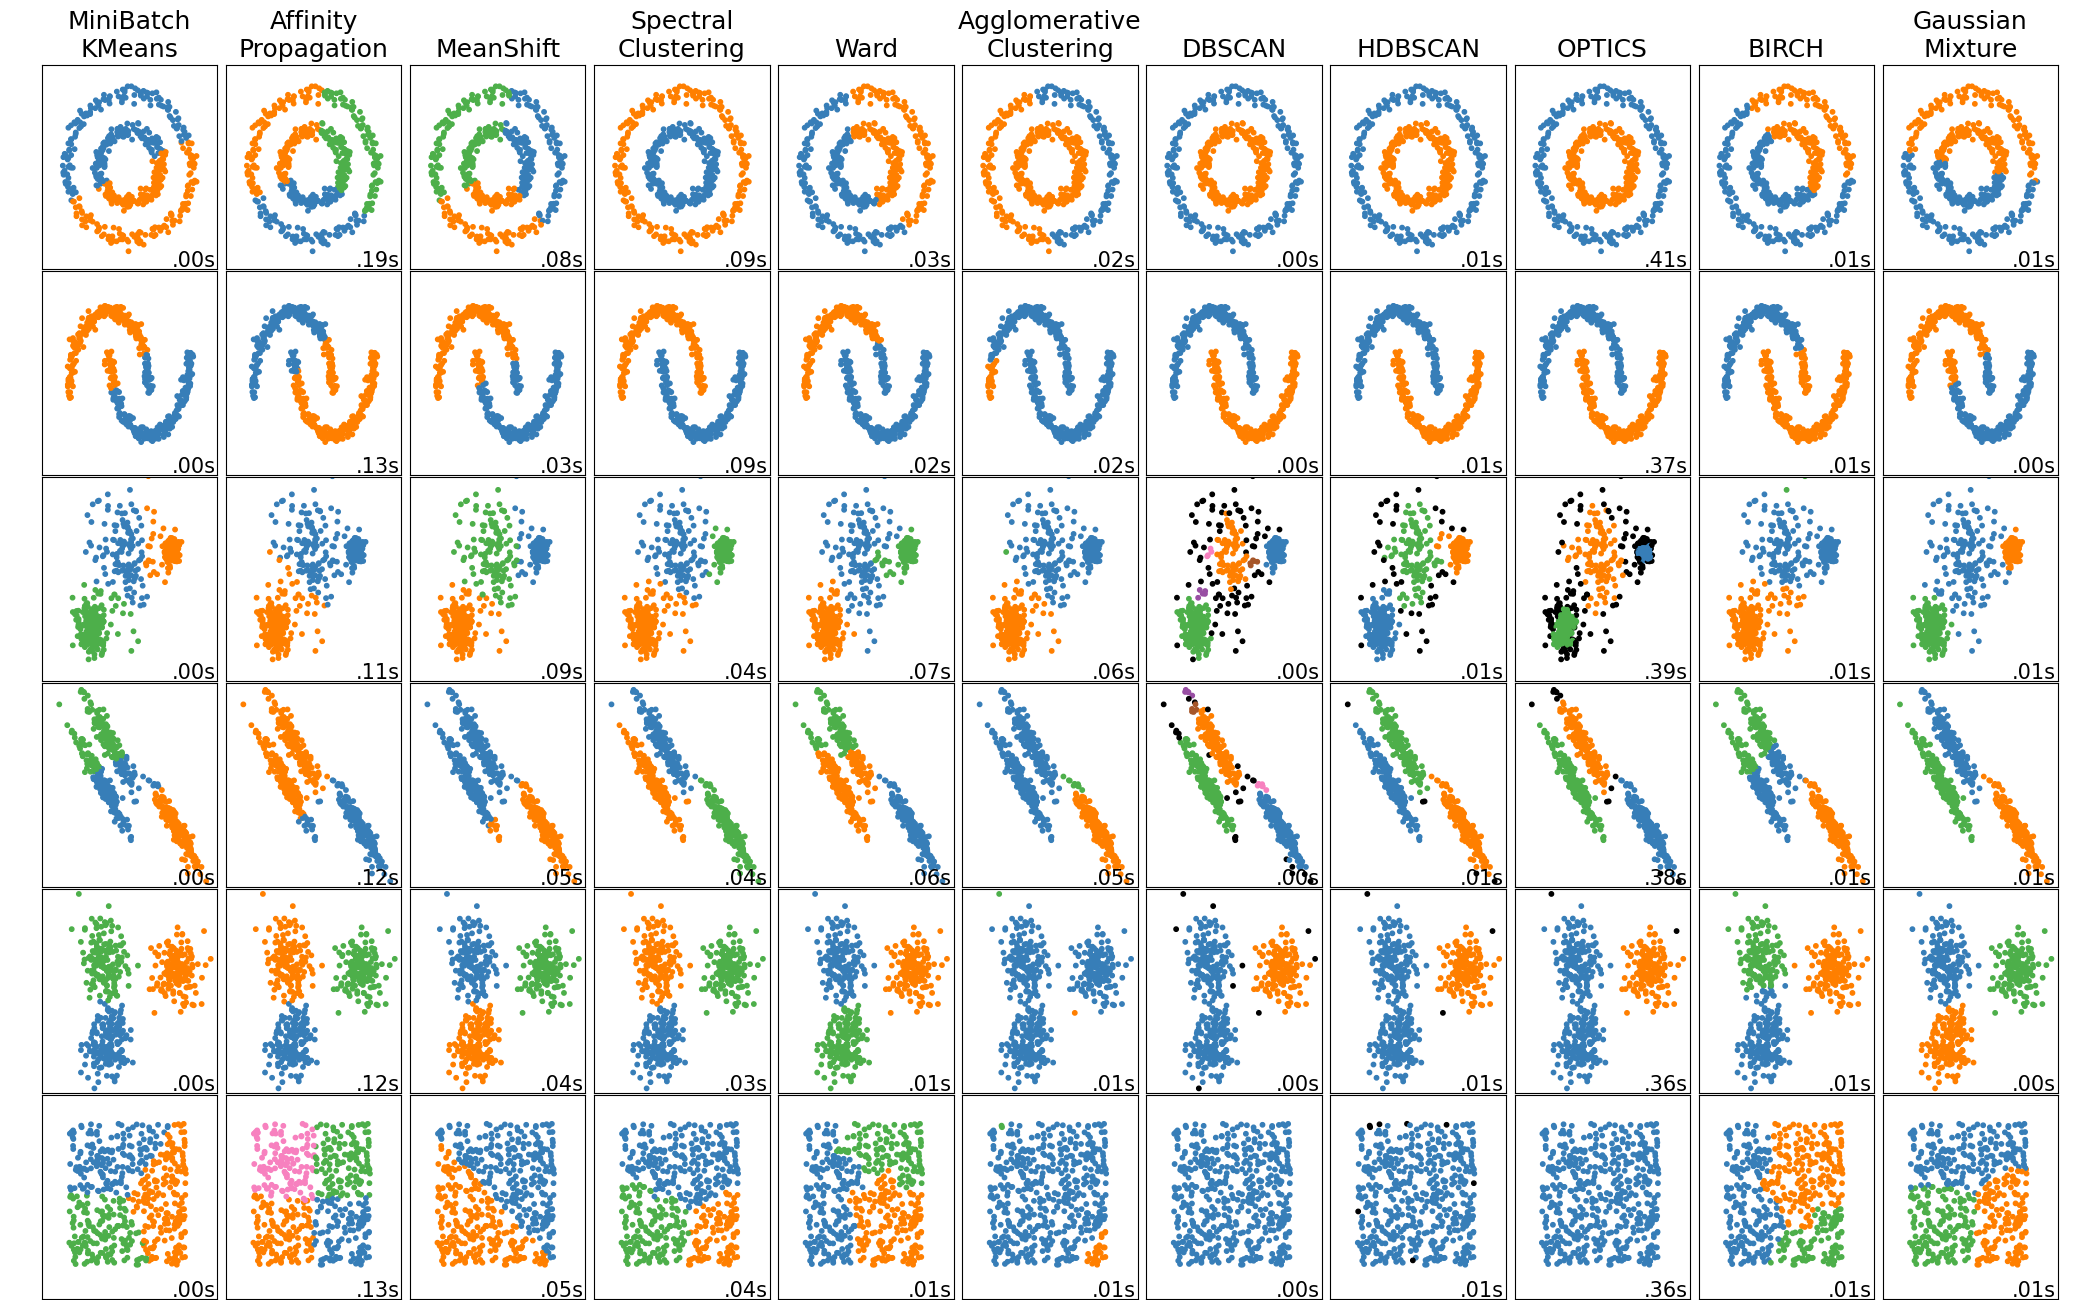
In the "Scikit-learn Algorithm Comparison" image, focus on the columns for MiniBatch K-Means (a scalable variant of K-Means), Agglomerative Clustering (Hierarchical), and DBSCAN.
- Row 1 (Concentric Circles): Confirms our previous observation. DBSCAN is the clear winner.
- Row 2 (Moons): K-Means and Agglomerative Clustering fail to separate the two intertwined crescent shapes. DBSCAN succeeds perfectly.
- Row 3 (Blobs): This is a classic K-Means use case. All three algorithms work well.
- Row 4 (Anisotropic Blobs): When the spherical assumption is violated (the blobs are stretched and rotated), K-Means struggles. DBSCAN and Agglomerative Clustering perform better.
- Row 6 (No Structure): On uniformly random data, K-Means and Agglomerative Clustering still impose a structure by partitioning the data, even though no true clusters exist. DBSCAN correctly identifies almost all points as noise (though this isn't perfectly clear in this specific plot, it is the expected behavior).
This visual evidence is crucial for building your intuition. You can see how an algorithm's "bias"—be it for spherical shapes or for density—determines its success or failure.
A Framework for Choosing Your Algorithm
Based on this analysis, we can build a simple decision-making framework. When faced with a clustering task, ask yourself the following questions:
-
What is the scale of my dataset?
- Large (e.g., >10,000s of samples): K-Means (or MiniBatchKMeans) is often the best choice due to its high scalability. Hierarchical clustering is usually too computationally expensive. DBSCAN can work but may be slow on high-dimensional data.
- Small to Medium: All three are viable options.
-
What is the likely shape of the clusters?
- Globular, Spherical: K-Means is a strong and efficient baseline.
- Complex, Non-spherical, Arbitrary: DBSCAN is the clear favorite. Hierarchical clustering with single linkage can sometimes find non-convex shapes but is very sensitive to noise.
- Unknown: Start with DBSCAN or explore with Hierarchical clustering's dendrogram to get a sense of the structure.
-
Does my dataset contain significant noise or outliers?
- Yes: DBSCAN is an excellent choice as it can explicitly identify and isolate noise.
- No (or data is pre-cleaned): K-Means and Hierarchical clustering are less affected. However, remember that K-Means will still force every point into a cluster, which can be misleading.
-
Do I know the number of clusters (
k) in advance?- Yes: K-Means is designed for this. You can also "cut" a hierarchical dendrogram at the level that produces
kclusters. - No: DBSCAN automatically determines the number of clusters, which is a significant advantage in exploratory analysis. Hierarchical clustering's dendrogram also allows you to explore different numbers of clusters without re-running the entire algorithm.
- Yes: K-Means is designed for this. You can also "cut" a hierarchical dendrogram at the level that produces
Here is a summary table:
| Feature | K-Means | Hierarchical (Agglomerative) | DBSCAN |
|---|---|---|---|
| Primary Assumption | Clusters are spherical (globular) | Data has a nested/hierarchical structure | Clusters are dense regions separated by sparse areas |
| Cluster Shape | Spherical | Depends on linkage (often convex) | Arbitrary shapes |
| Handles Noise? | No (sensitive to outliers) | No (sensitive, especially single linkage) | Yes (explicitly identifies noise points) |
| # of Clusters | Must be specified (k) |
Chosen by cutting the dendrogram | Determined automatically by the algorithm |
| Scalability (Time) | Excellent (linear), very fast | Poor (at least quadratic), slow on large data | Good, but can be slow on high-dimensional data |
| When to Use | Large datasets, known k, globular clusters |
Small datasets, need to explore hierarchy | Noisy data, non-spherical clusters, unknown k |
Conclusion
In this final lesson on clustering, you have synthesized your knowledge of K-Means, Hierarchical Clustering, and DBSCAN into a comparative framework. You now understand that there is no single "best" clustering algorithm; the optimal choice is always contingent on the specific characteristics of your data and the goals of your analysis.
Key Takeaways:
- K-Means is your fast, scalable choice for large datasets where you expect roughly spherical clusters and have a reasonable estimate for
k. - Hierarchical Clustering is best for smaller datasets where you want to explore the nested relationships between data points and visualize the structure using a dendrogram.
- DBSCAN is your go-to algorithm for datasets with noise, outliers, and clusters of arbitrary, non-spherical shapes. Its ability to automatically determine the number of clusters is a powerful feature for exploratory analysis.
What's Next:
Having completed our survey of clustering, we will now move to another crucial area of unsupervised learning: dimensionality reduction. In the next lesson, you will learn about the "curse of dimensionality" and be introduced to Principal Component Analysis (PCA), a fundamental technique for reducing the number of features in a dataset while preserving as much information as possible. This is a common preprocessing step for both supervised and unsupervised learning tasks, including clustering itself.