Hello! In our previous lessons, you've learned to explore datasets by visualizing both individual variables (univariate analysis) and the relationships between them (bivariate analysis). You now have a solid toolkit for understanding the structure and connections within your data.
In this lesson, we will shift our focus from exploration to inspection. We'll leverage the analytical skills you've developed to start the crucial process of data cleaning. You will learn how to identify three of the most common and impactful data quality issues that can derail a machine learning project: missing values, outliers, and class imbalance. Spotting these problems early is a fundamental skill for any data scientist, ensuring the data you feed into your models is sound and reliable.
The Importance of Data Quality
The principle of "garbage in, garbage out" is especially true in machine learning. No matter how sophisticated an algorithm is, its performance will be poor if the underlying data is flawed. Exploratory Data Analysis (EDA) is our first line of defense, allowing us to proactively detect these issues before they compromise our models.
The following video provides an excellent overview of why EDA is a critical first step, framing it as a process for understanding data, assisting with cleaning, and uncovering relationships.
Exploratory Data Analysis Step-by-Step Walkthrough | Python Pandas Tutorial | Data Science Tutorial
This video from Data Analytics Lab introduces the core purpose of EDA.
Watch the first few minutes to understand the three key reasons why EDA is a crucial step in any data science project. This will set the context for the specific quality checks we're about to perform.
We will focus on three key types of data issues that EDA helps us uncover. Let's dive in.
1. Identifying Missing Values
Missing values, often represented as NaN (Not a Number) in pandas, are gaps in your dataset where data was not collected or was lost. Most machine learning algorithms cannot process data with missing values, so identifying them is a mandatory first step.
Programmatic and Visual Detection
You can get a quick count of missing values per column using pandas. However, to understand the pattern of missingness, a visual approach is often more powerful. A heatmap can instantly show you which columns have missing data and whether there are any rows with multiple missing entries.
The following article from KDnuggets presents a series of practical Python techniques for EDA. We'll use it as a guide, starting with its method for detecting missing values. It also provides a handy synthetic dataset with pre-injected data issues that we can use for practice.
7 Python EDA Tricks to Find and Fix Data Issues - KDnuggets
This article provides concise, practical code snippets for identifying common data quality problems.
First, read the Introduction and copy the preamble code into your Python environment (e.g., a Jupyter Notebook). This will create a sample DataFrame df with the data issues we want to find. Next, study the section on detecting missing values. Pay close attention to how the isnull() method is used both for a numerical summary (.sum()) and as input to a seaborn heatmap for a visual overview.
After running the code, you should see a visualization similar to this one:
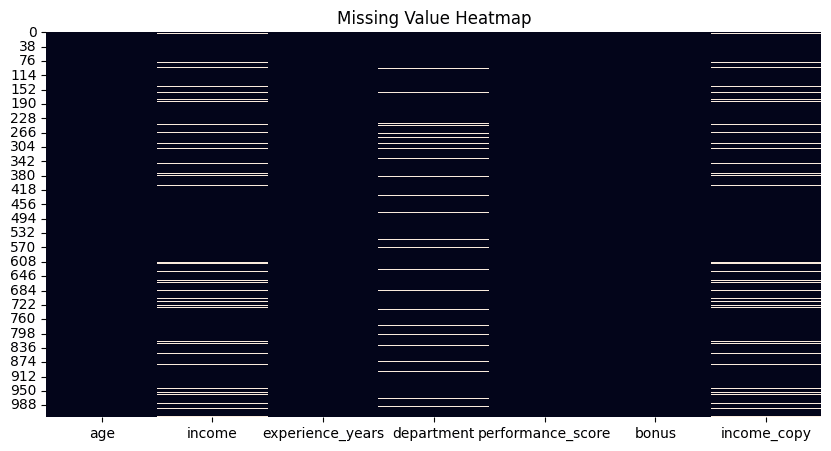
This visual approach is powerful because it can reveal patterns. For example, if you see that missing values in two columns often occur in the same rows, it might suggest a systematic reason for the data loss.
2. Identifying Outliers
Outliers are data points that deviate significantly from the rest of the observations. They can be genuine extreme values (e.g., a CEO's salary in an employee dataset) or errors (e.g., a human height of 20 feet). They are important because they can skew statistical measures and disproportionately affect the performance of many machine learning models.
Visual Detection with Box Plots
In our first lesson, you learned about box plots for univariate analysis. They are also an excellent tool for outlier detection. The "whiskers" of the plot define the expected range of the data, and any points that fall outside these whiskers are flagged as potential outliers.
The Data Analytics Lab video you watched earlier has a great segment on this.
Exploratory Data Analysis Step-by-Step Walkthrough | Python Pandas Tutorial | Data Science Tutorial
Let's revisit the Data Analytics Lab video to see how box plots are used to spot outliers.
Watch the portion of the video that explains how to interpret box plots for outlier detection. The presenter clearly explains how the different parts of the box relate to the data's distribution and how points outside the whiskers are identified.
Statistical Detection with the Interquartile Range (IQR) Method
The visual intuition of a box plot is formalized by the Interquartile Range (IQR) method. This is a robust statistical technique for flagging outliers. Here's the logic:
- Find Quartiles: Calculate the first quartile (Q1, the 25th percentile) and the third quartile (Q3, the 75th percentile).
- Calculate IQR: The IQR is the range between these quartiles: .
- Define Fences: Create "fences" or limits for our data. The standard rule is to place them 1.5 times the IQR below Q1 and above Q3.
- Lower Fence:
- Upper Fence:
- Identify Outliers: Any data point that falls below the lower fence or above the upper fence is considered an outlier.
The following video from the codebasics channel provides an exceptionally clear explanation of this theory and its implementation in Python.
Outlier detection and removal using IQR | Feature engineering tutorial python # 4
This video provides a fantastic walkthrough of the IQR method for outlier detection.
First, watch the theoretical explanation covering percentiles and IQR. Next, focus on how the upper and lower limits are calculated using the 1.5 * IQR rule. Finally, see how this is implemented in Python, using .quantile() to find Q1 and Q3 and then filtering the DataFrame to programmatically find outliers.
You can now apply this logic to the synthetic dataset from the KDnuggets article. The article itself provides a convenient function in Trick #3 that encapsulates this process. Try using it to find outliers in the 'income' column of the df you created.
3. Identifying Class Imbalance
Class imbalance occurs in classification problems when the different classes are not equally represented. For instance, in a dataset for fraud detection, the number of non-fraudulent transactions (majority class) will vastly outnumber fraudulent ones (minority class).
This is a problem because most machine learning models are optimized for accuracy. A naive model can achieve 99% accuracy on a dataset with a 99:1 class split by simply always predicting the majority class, making it useless for detecting the rare, important events.
Identifying Imbalance with Value Counts
Identifying class imbalance is straightforward. You can use the .value_counts() method on your target variable's column in pandas to see the distribution. A bar plot or seaborn.countplot of these values provides an immediate visual confirmation.
The following article from Analytics Vidhya explains why class imbalance is a critical issue and how to spot it.
10 Techniques to Solve Imbalanced Classes in Machine ...
This article provides a deep dive into the problem of imbalanced classes in machine learning.
First, read the sections explaining the core problem and illustrating it with a credit card fraud example. Next, read the section on "The Metric Trap", which clearly explains why accuracy is a misleading metric for imbalanced datasets.
In future lessons, we will cover techniques to handle this, such as over-sampling the minority class or under-sampling the majority class. For example, a common technique called SMOTE (Synthetic Minority Over-sampling Technique) generates new, synthetic examples of the minority class to create a balanced dataset.

For now, the key is simply to be able to identify that the problem exists in your dataset by checking the distribution of your target variable.
Conclusion
In this lesson, you've taken a major step in the data preprocessing journey by learning to diagnose critical data quality issues. You now have the skills to move beyond simple exploration and begin to critically evaluate your data's fitness for machine learning.
Here are the key takeaways:
- Data Quality is Paramount: The quality of your data directly dictates the quality of your model's predictions.
- Missing Values: Identify these using
df.isnull().sum()for a numerical summary and aseaborn.heatmapofdf.isnull()for a powerful visual overview of their patterns. - Outliers: Detect these visually using box plots and statistically using the IQR method, which defines a valid data range using fences set at and .
- Class Imbalance: In classification tasks, always check your target variable's distribution using
.value_counts(). A significant skew between classes can make accuracy a misleading metric and requires special handling.
Now that you can identify these issues, our next lessons will focus on how to fix them. We will begin by exploring the common patterns of missing data and discussing various strategies to handle them, such as deletion and imputation.