Hello! Welcome to the next lesson in your journey through practical network analysis.
In our previous session, we used wget and curl to fetch files from the web. Every time you ran those commands, data packets silently traveled across your network. Today, we're going to learn how to make that invisible traffic visible.
This lesson directly addresses the learning outcome: Capture and inspect network packets using tcpdump with basic filters. As an aspiring ethical hacker, being able to "see" what's happening on the network is a superpower. It's essential for troubleshooting, analyzing application behavior, and detecting suspicious activity. Since you're comfortable with the command line, tcpdump will be a powerful addition to your arsenal, especially when working on servers or systems without a graphical user interface.
1. What is tcpdump?
tcpdump is a command-line packet analyzer. It allows you to intercept and display network packets that are being transmitted or received over a network. Think of it as the command-line equivalent of Wireshark.
Most Linux distributions, including Arch, come with tcpdump pre-installed. You can verify this with which tcpdump. If for some reason it's not there, you can install it with sudo pacman -S tcpdump.
Let's watch a short introduction.
tcpdump - Traffic Capture & Analysis
The video 'tcpdump - Traffic Capture & Analysis' by HackerSploit provides a great overview of what tcpdump is and why it's a vital tool, especially in environments without a GUI.
Please watch from 01:04 to 02:51. This section explains the role of tcpdump and its importance for command-line-only environments, which you'll frequently encounter in penetration testing.
A crucial point to remember is that capturing network packets requires elevated privileges because tcpdump needs to listen on a network interface in a special "promiscuous mode."
packet capture tutorial using tcpdump
The video 'packet capture tutorial using tcpdump' from BlueMonkey 4n6 quickly demonstrates the need for sudo and how to stop a capture.
Watch from 00:22 to 01:46. Pay attention to the permission error and how it's solved with sudo, and note the use of Ctrl+C to stop the capture and the -c flag to limit the number of packets.
So, almost all tcpdump commands you run will start with sudo. To stop a capture, you simply press Ctrl+C.
2. Core Concepts: Interfaces, Output, and Saving
Before we dive into filtering, let's cover a few essential concepts.
Selecting a Network Interface (-i)
A computer can have multiple network interfaces (e.g., a wired eth0/enp... interface, a wireless wlan0 interface, and the lo loopback interface for local traffic). You must tell tcpdump which interface to listen on.
You can list available interfaces using ip a (which you know) or tcpdump -D.
# List interfaces tcpdump can use
sudo tcpdump -D


# Example: Capture on the 'eth0' interface
sudo tcpdump -i eth0
Understanding the Output
When you run tcpdump, each line represents one packet. Let's break down a typical line:
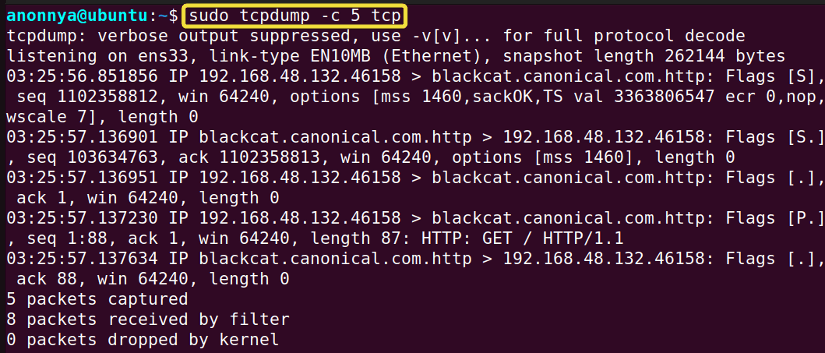
A standard tcpdump line looks something like this:21:28:43.123456 IP your_pc.45678 > some_server.https: Flags [S], seq 12345, win 64240, options [mss 1460], length 0
21:28:43.123456: The timestamp of the capture.IP: The protocol (in this case, IPv4).your_pc.45678: The source hostname and port.>: The direction of traffic.some_server.https: The destination hostname and port.Flags [S]: TCP flags (e.g.,Sfor SYN,.for ACK,Pfor PUSH,Ffor FIN).- The rest is additional protocol-specific information.
By default, tcpdump tries to resolve IP addresses and port numbers to names (e.g., 8.8.8.8 becomes dns.google and port 53 becomes domain). This can be slow. Use the -n flag to show numeric IP addresses and -nn to show numeric ports as well.
sudo tcpdump -i eth0 -nn
Saving and Reading Captures (-w and -r)
Displaying packets in the terminal is useful for real-time monitoring, but for detailed analysis, you'll want to save the capture to a file. This is done with the -w (write) flag, creating a .pcap (packet capture) file.
This .pcap file can then be analyzed later with tcpdump using the -r (read) flag, or with graphical tools like Wireshark.

Here is the process:
- Capture and write to a file:
sudo tcpdump -i eth0 -w my_capture.pcap - Read from the file:
tcpdump -r my_capture.pcap(Note:sudois not needed to read a file).
3. Basic Filtering: Isolating the Traffic You Need
Capturing all traffic on an interface can be overwhelming. The true power of tcpdump comes from its filtering capabilities. Filters are expressions that tell tcpdump what packets to show you.
For a great overview of the most common filters, let's turn to a textual resource.
TCPdump for Beginners: What It Is, How to Install, and Key Commands
The article 'TCPdump for Beginners' provides a clear, concise summary of the most important filter types. This will serve as a good foundation.
Please read the section titled 'TCPdump Filtering'. It covers the essential filter types: host, network, and port, as well as how to combine them.
Let's consolidate and practice these filters.
Filter Primitives
Filters are built from one or more primitives. The main types are:
host: Filters for traffic involving a specific IP address or hostname.sudo tcpdump -nn -i eth0 host 8.8.8.8(traffic to or from 8.8.8.8)
net: Filters for traffic within a whole network range.sudo tcpdump -nn -i eth0 net 192.168.1.0/24
port: Filters for traffic using a specific port.sudo tcpdump -nn -i eth0 port 443(HTTPS traffic)
proto: Filters for a specific protocol. You can also just use the protocol name.sudo tcpdump -i eth0 icmpsudo tcpdump -i eth0 udp
Filter Qualifiers
You can make primitives more specific with qualifiers:
src: Matches the source address/port.sudo tcpdump -nn -i eth0 src host 192.168.1.10
dst: Matches the destination address/port.sudo tcpdump -nn -i eth0 dst port 22
Combining Filters
You can combine these expressions using logical operators:
and(or&&): All conditions must be true.or(or||): At least one condition must be true.not(or!): Inverts the condition.
When combining filters, it's good practice to wrap the filter expression in single quotes ' to prevent the shell from interpreting special characters.
Example: Capture TCP traffic from host 192.168.1.100 that is NOT going to port 22 (SSH).
sudo tcpdump -nn -i eth0 'src host 192.168.1.100 and tcp and not dst port 22'
The HackerSploit video provides excellent demonstrations of these filters in action.
tcpdump - Traffic Capture & Analysis
Let's watch how to apply these filters in a real terminal.
This video walks through all the filters we've discussed. You can watch it straight through or use the timestamps to jump to specific filters. Host filter (host): 06:05 - 07:40 Source/Destination (src, dst): 08:06 - 09:48 Combining filters (and): 09:52 - 11:24 Network filter (net): 11:24 - 12:51 Protocol filter (tcp): 13:15 - 14:18 Port filter (port, src port, dst port): 14:22 - 17:06 Saving to a file (-w): 18:48 - 22:46
For a quick reference of many useful commands, Daniel Miessler's article "A tcpdump Tutorial with Examples" is an invaluable resource to bookmark. Don't worry about memorizing it all; just know that it's there when you need a specific command.
4. Hands-On Lab
Time to practice. For this lab, you'll need two terminals open.
- Terminal 1: Where you'll run
tcpdump. - Terminal 2: Where you'll generate traffic.
First, find your active network interface name (e.g., eth0, enp0s3, wlan0) with ip a. I'll use eth0 in the examples below—replace it with your own.
Activity 1: Capture ICMP Traffic (Ping)
We'll start by capturing ping requests.
- In Terminal 1, start
tcpdumpto listen for ICMP traffic. The-c 5flag will stop the capture after 5 packets.sudo tcpdump -nn -i eth0 -c 5 icmp - In Terminal 2, send a few pings to a public DNS server.
ping -c 2 8.8.8.8 - Observe the output in Terminal 1. You will see the ICMP "echo request" and "echo reply" packets.
Activity 2: Capture DNS Traffic
Let's see what a DNS query looks like. DNS typically uses UDP port 53.
- In Terminal 1, start listening on UDP port 53.
sudo tcpdump -nn -i eth0 -c 2 'udp port 53' - In Terminal 2, use
digto perform a DNS lookup.dig archlinux.org - You'll see the DNS query from your machine to your DNS resolver in Terminal 1.
Activity 3: Capture and Save Web Traffic
Now, let's tie this into our last lesson. We'll capture the traffic generated by curl.
- In Terminal 1, start
tcpdumpto capture traffic to or fromexample.comon port 80 and save it to a file namedwebtraffic.pcap.sudo tcpdump -i eth0 -w webtraffic.pcap 'host example.com and port 80' - In Terminal 2, use
curlto download the page.curl http://example.com - Once
curlfinishes, stop the capture in Terminal 1 by pressingCtrl+C. You'll see a summary of packets captured. - Finally, inspect the contents of your saved file.
You will see the TCP three-way handshake, the HTTP GET request, and the server's response, all from the file you just created.tcpdump -nn -r webtraffic.pcap
Conclusion
Excellent work. You have now learned how to capture, filter, and inspect network traffic from the command line—a fundamental skill for any security professional.
Key Takeaways:
tcpdumpis a command-line packet sniffer that requiressudoto run.- Always specify an interface with
-i(list them withtcpdump -D). Use-nnto prevent name resolution for cleaner output. - The most crucial workflow is capturing to a file with
-wfor later analysis with-ror other tools like Wireshark. - Filtering is essential. Master the use of primitives (
host,port,net,proto) and combine them with qualifiers (src,dst) and logical operators (and,or,not).
Next Lesson Preview:
We've seen how to download files and how to inspect the traffic they generate. Next, we need a secure way to transfer files between machines, a common task when moving tools or loot during a penetration test. In our next lesson, we will learn how to transfer files securely between machines using scp.