Welcome back! In our last lesson, we mastered the Pearson correlation coefficient, a powerful tool for measuring the strength and direction of a linear relationship. We concluded with a crucial warning, a mantra you will hear throughout your journey in statistics and data science: correlation does not imply causation.
Today, we will unpack that statement. While finding a strong correlation between two variables is exciting, jumping to a cause-and-effect conclusion is one of the most common and dangerous errors in data analysis. This lesson is dedicated to helping you build the critical thinking skills to distinguish between a statistical association and a true causal link. We will explore the primary reasons why two variables might be correlated without one causing the other, using illustrative examples to make these concepts concrete.
Correlation vs. Causation: The Fundamental Distinction
Let's begin by formally defining our terms. This is a crucial distinction that forms the foundation of sound statistical reasoning.
Correlation vs. Causation | Difference, Designs & Examples
This article from Scribbr provides clear, concise definitions for both correlation and causation.
Please read the introductory paragraphs, starting from the main definitions, and continue through the "What's the difference?" section, ending at this key sentence.
As the reading highlights, the relationship is asymmetric. If a change in variable A causes a change in variable B, then A and B will be correlated. However, if A and B are correlated, we cannot conclude that A causes B. Causation is a subset of correlation.
The following Venn diagram illustrates this relationship perfectly.

So, if it's not a causal link, what explains the correlation we observe? The answer typically falls into one of three scenarios.
1. The Third Variable Problem (Confounding)
Perhaps the most common reason for a misleading correlation is a confounding variable. This is an unobserved, "lurking" third variable that affects both of the variables we are studying, creating a spurious association between them.
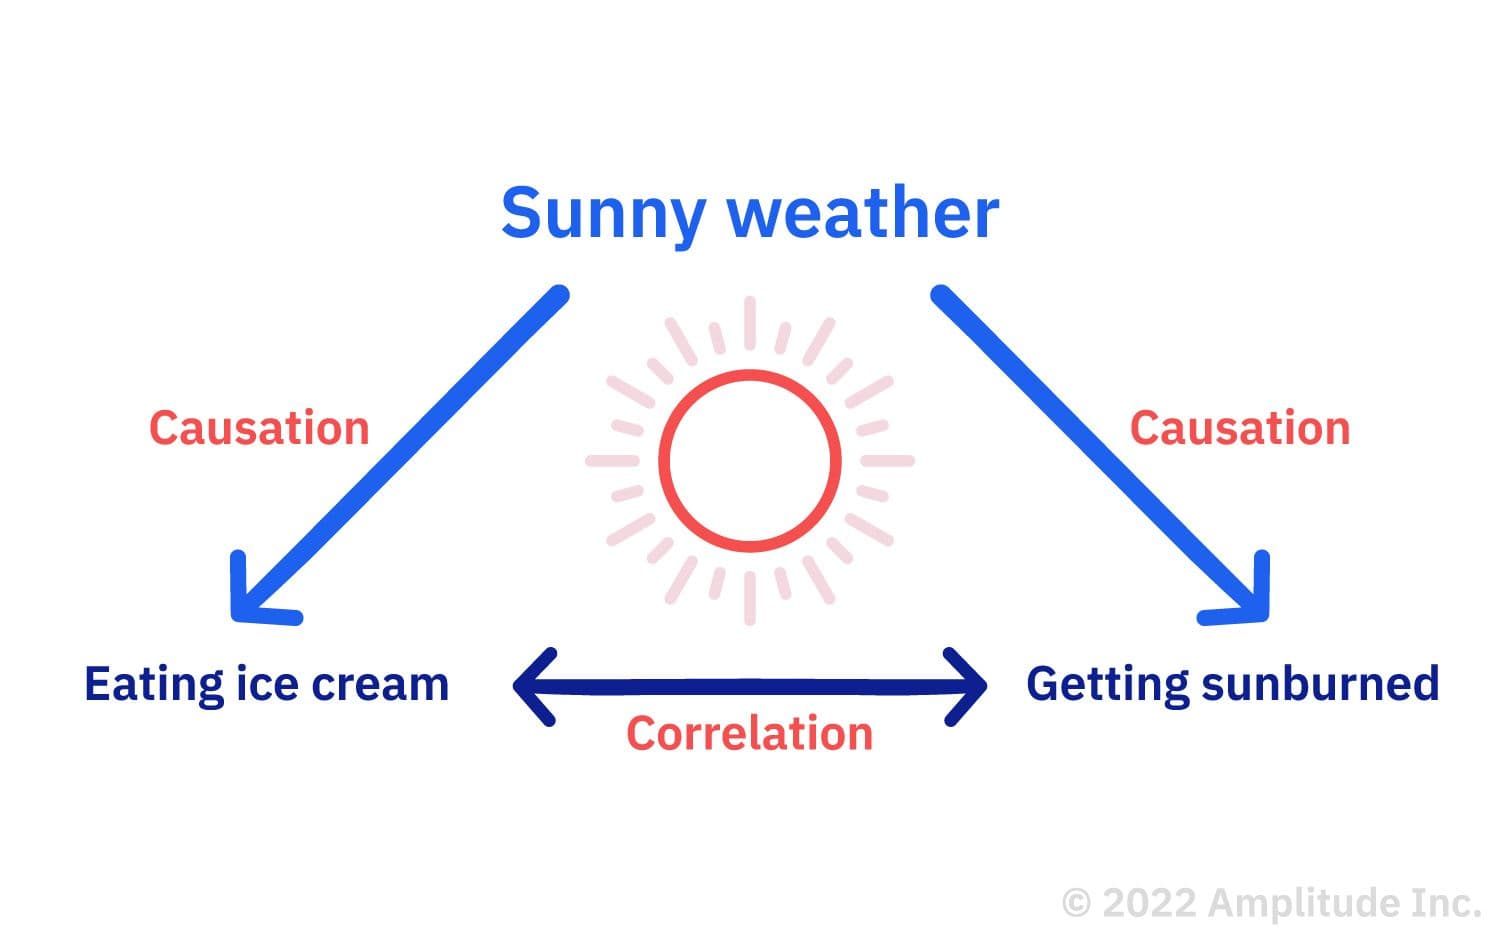
A classic example is the strong positive correlation between ice cream sales and shark attacks. The more ice cream is sold, the more shark attacks occur. Does eating ice cream make people more attractive to sharks? Of course not. The third variable is hot weather.
- Hot weather causes more people to buy ice cream.
- Hot weather causes more people to go swimming in the ocean, increasing their exposure to sharks.
The confounding variable, hot weather, is the true driver behind both trends. The ice cream and shark attacks are correlated only because they are both effects of the same cause.
The following video explains this concept clearly.
Correlation vs Causation I Explained
This clip from the "Psych Explained" channel provides another excellent breakdown of the third variable problem.
Watch the section from the beginning of the explanation on the third variable problem. The video uses the ice cream/shark attack example and another great one: the correlation between family dinners and a child's school performance.
2. The Directionality Problem (Reverse Causality)
Sometimes, two variables are indeed causally linked, but the direction of the relationship is the reverse of what we might assume. We might think A is causing B, when in fact, B is causing A.
For example, a study might find a strong positive correlation between stress and lack of sleep. It's plausible to assume that high stress levels cause poor sleep. However, it's equally plausible that chronic sleep deprivation causes an increase in stress levels.
Correlation vs. Causation | Difference, Designs & Examples
Let's return to the Scribbr article for a formal definition and another example.
Read the short paragraph defining the directionality problem. Then, scroll down to the section with the same heading and read the example about physical activity and self-esteem, which illustrates the potential for a bidirectional relationship.
Without a carefully designed experiment, a simple correlation cannot tell us the direction of the causal arrow, or if it points in both directions, creating a feedback loop.
3. Spurious Correlation by Coincidence
In a world filled with data, and with the computational power to analyze it, we are bound to find variables that move together purely by chance. Given enough variables, you will inevitably find some that are highly correlated for no logical reason at all. This is especially true in computer science and data science, where analysts might sift through thousands of potential features (a process sometimes called "data dredging" or "p-hacking").
This leads to humorous, yet illustrative, examples of spurious correlations.
When two things seem linked (but aren't) - ClearerThinking.org
This article from ClearerThinking.org highlights some of the most famous examples of correlations that are simply random flukes.
Read the section titled Random fluke. Pay attention to the absurdly high correlation coefficients for completely unrelated phenomena, like margarine consumption and the divorce rate in Maine. This demonstrates how numbers alone, without a plausible mechanism, are meaningless.
These examples serve as a powerful reminder: a high value is not evidence in itself. It is merely an observation that requires a plausible explanation. Without one, it may just be noise.
So, How Is Causation Established?
If correlation alone is insufficient, how do scientists and researchers establish a cause-and-effect relationship? The gold standard is the Randomized Controlled Trial (RCT). In an RCT, researchers:
- Create two or more groups that are statistically identical on average.
- Intentionally apply a treatment (the supposed cause) to one group (the "treatment group") but not the other (the "control group").
- Measure the outcome in both groups.
Because the only systematic difference between the groups is the treatment, any significant difference in the outcome can be confidently attributed to that treatment. This methodology is the foundation of clinical trials for new medicines and is also used in the tech world in the form of A/B testing to determine, for example, if a change in a user interface causes a change in user engagement.
Correlation vs Causation Explained: Why Patterns Can Mislead Us
This video from Sprouts gives a quick overview of the methods social scientists use to get closer to proving causation.
For context, watch the segment from the description of Randomized Controlled Trials. This will give you a sense of how experimental design overcomes the limitations of simple observation.
Conclusion
Today, we've moved beyond the calculation of correlation to the critical interpretation of what it means—and what it doesn't. You now have a framework for questioning any observed relationship between two variables.
Key Takeaways:
- Causation implies correlation, but correlation does not imply causation.
- When you see a correlation between two variables, A and B, always consider the alternative explanations before assuming A causes B.
- Confounding: Is there a third variable, C, that is causing both A and B? (e.g., hot weather)
- Directionality: Could it be that B causes A, or is the relationship bidirectional? (e.g., stress and sleep)
- Coincidence: With billions of variables in the world, could this correlation be a random fluke? (e.g., margarine and divorce)
- Establishing causation requires more than just observational data; it typically demands a well-designed experiment that can isolate the effect of a single variable.
In our next lesson, we will shift gears slightly from statistical theory to a practical data management skill. We will address how to combine multiple datasets using techniques like joins and concatenation. This is a fundamental step in almost any data science project, where the information you need is often spread across several different files or databases.