Hello! Welcome to your next lesson in the "Harnessing Google Gemini Pro Features" module.
In our last session, we explored the strategic power of Gemini's large context window, which allows you to analyze entire documents like annual reports in a single conversation. We discussed how this holistic view improves understanding and enables complex, multi-document analysis.
Today, we'll build on that by exploring another of Gemini's core strengths. This lesson will teach you how to use Gemini Pro's multimodal input to analyze and interpret charts, diagrams, or visual content. While the last lesson focused on processing vast amounts of text, this one is about making sense of the visuals that text often contains. For your work in finance and your startup ambitions, the ability to quickly extract data from charts, understand diagrams, and even generate new visuals is a significant productivity multiplier.
1. What is Multimodality?
At its core, a multimodal AI is one that can understand, interpret, and combine information from different types of data—not just text. This includes images, audio, and video. While older AIs were primarily text-in, text-out, models like Gemini are built to process these different "modes" of information together.

This capability means you can have a conversation with Gemini that seamlessly blends text and images. You can upload a chart and ask questions about it, or describe a concept and ask it to create a diagram. Let's see how this works in practice.
2. From Image to Insight: Analyzing Existing Visuals
A significant part of your work likely involves interpreting charts and diagrams from various sources—presentations, PDFs, or even photos from a meeting. Gemini can act as a powerful assistant in these scenarios.
Extracting Data from Images
One of the most practical uses of multimodality is optical character recognition (OCR) supercharged with AI understanding. You can give Gemini an image containing text or numbers, and it can not only extract the data but also structure and analyze it.
Google's New AI Creates Dashboards at INSANE Speeds
Let's watch a clear demonstration of this. The following clip from Excel Campus - Jon shows how Gemini can take a simple phone picture of handwritten prices and turn it into structured, analyzable data.
Please watch the segment from 03:39 to 05:38. Pay close attention to the two-step process: first, asking Gemini to extract the data from the image into a table, and second, asking it to perform a calculation and create a new visualization (the bar chart) from that extracted data.
This technique is incredibly useful for:
- Digitizing data from scanned documents or old reports where you can't copy-paste.
- Capturing information from a whiteboard or presentation slide during a meeting.
- Quickly comparing product specs or prices from photos.
Interpreting Financial Charts
Given your background, you'll find Gemini's ability to analyze financial charts particularly relevant. You can upload a screenshot of a stock chart and ask it to identify patterns or explain technical indicators.
How to Use Gemini for Financial Analysis and Stock Market Insights
This article, 'How to Use Gemini for Financial Analysis and Stock Market Insights', provides direct examples of using Gemini for technical analysis. It also includes a critical warning about the reliability of AI in this context.
Please read the sections titled 'Technical Chart Pattern Recognition' and 'The "Hallucination" Hedge'. Focus on the example prompt for identifying a chart pattern and, most importantly, the 'trust but verify' workflow outlined in the second section. This cautious approach is vital for any professional financial application.
The key takeaway here is that Gemini can be a powerful educational or confirmation tool. You can use it to get a "second opinion" on a chart pattern you think you've spotted or to quickly learn the characteristics of a new pattern. However, as the article wisely cautions, you must always verify its outputs and never use it as a sole basis for trading decisions.
3. From Data to Dashboard: Generating New Visuals
Beyond interpreting existing visuals, Gemini can create new ones from data you provide. This is where you can turn raw numbers or dense text into insightful, easy-to-digest charts and dashboards.
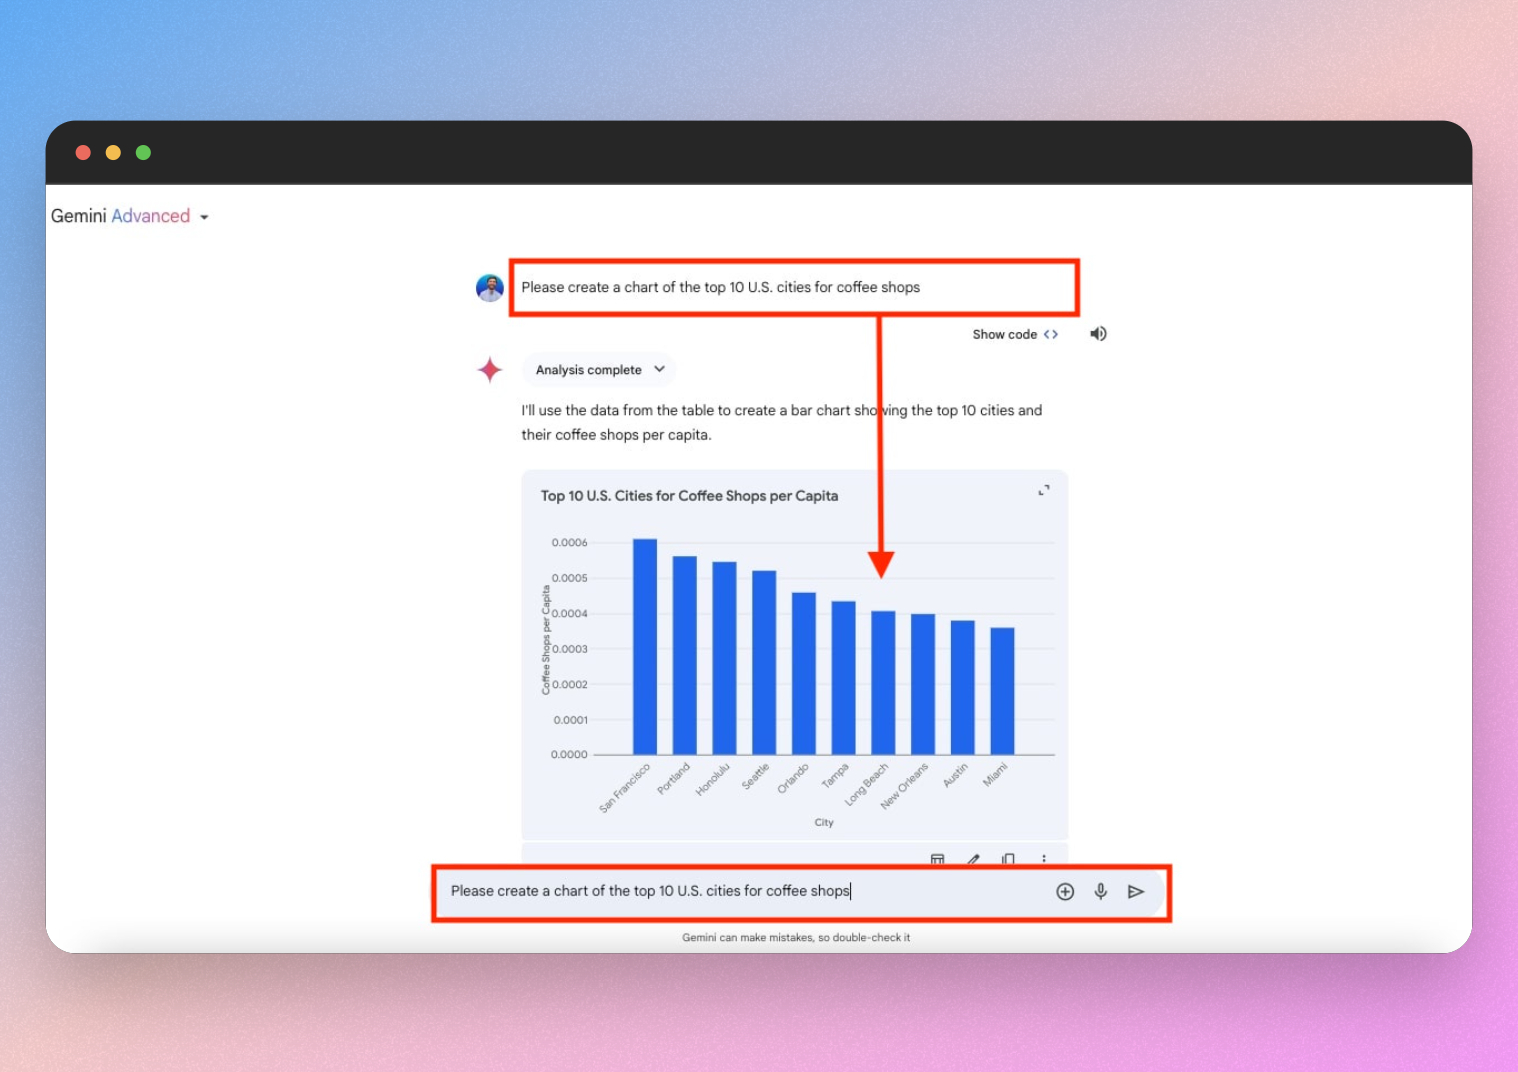
Let's look at a more in-depth example.
Google's New AI Creates Dashboards at INSANE Speeds
The same video from Excel Campus - Jon we watched earlier also contains excellent demonstrations of generating entire dashboards from data files.
Please watch the clips from 00:32 to 02:22 and 02:22 to 03:50. The first part shows Gemini creating a dashboard from an uploaded Excel file. The second shows it creating a themed visual summary from a text-heavy PDF earnings report. Notice how you can guide the 'style' of the output with your prompt.
This workflow is transformative for tasks like:
- Rapidly Prototyping Dashboards: Get initial ideas for how to visualize a new dataset.
- Summarizing Reports: Turn a dense, text-based report (like a 10-K filing) into a high-level visual summary for a presentation.
- Stylizing Presentations: Generate on-brand charts and backgrounds, moving beyond generic templates. The article "How to Use Gemini for Financial Analysis" discusses this further in the sections "Visualizing Market Sentiment with Image Gen" and "Reverse Engineering Financial Infographics."
For your interest in programming, it's worth noting that Gemini can even generate interactive charts using its 'Canvas' feature, which essentially writes the HTML, CSS, and JavaScript code for you. This bridges the gap between static images and simple web applications.
4. Practice Exercise: From Chart to Analysis
Let's put these concepts into practice with a scenario relevant to your work.
Imagine you're reviewing a competitor's investor presentation, which is only available as a scanned PDF. You find the following chart, and you need to quickly understand and re-purpose the data for an internal memo.
This is a sample bar chart showing fictional 'Global Server Market Share for Q4 2023'. It displays market share percentages for four companies: Dell, HPE, Inspur, and Lenovo.
Your Task:
- Save the chart image above to your computer.
- Open a new chat in Google Gemini and upload the image.
- Use a series of prompts to accomplish the following:
- Prompt 1 (Extraction): Ask Gemini to extract the data from the chart and present it as a markdown table.
- Prompt 2 (Interpretation): Ask a question that requires interpretation, such as "Based on this chart, what is the combined market share of the top two companies?" or "Which company has the smallest share?"
- Prompt 3 (Re-visualization): Ask Gemini to create a new image of this data, but as a pie chart. Add a style instruction, for example: "...create a pie chart with a clean, minimalist design and a professional color palette."
This exercise will take you through the full workflow: uploading a visual, extracting structured data from it, asking interpretive questions, and generating a new visualization in a different style.
Conclusion
Today you've learned how to leverage Gemini's multimodal capabilities to work with visual information. This skill allows you to bridge the gap between the visual world of charts and diagrams and the structured world of data and analysis.
Key Takeaways:
- Multimodality is the ability of an AI to process and integrate information from various formats like text, images, and video.
- You can extract structured data (like tables) from images of charts, even if they are handwritten or part of a non-digital document.
- Gemini can interpret financial charts to identify technical patterns, but this should be used for education and confirmation, always following a "trust but verify" principle.
- You can generate new visualizations, from simple charts to entire dashboards, by uploading data files (Excel, PDF) or simply describing what you want in a text prompt.
In our next lesson, we will get even more hands-on with data. We will dive into using Gemini within Google Sheets to generate formulas, organize data, and create analysis templates. This will move us from analyzing images of data to manipulating raw data directly within a powerful spreadsheet environment.