Hello! Welcome to a brand new module in your Alteryx journey.
In the previous module, we focused on building and distributing interactive tools for other users by mastering Analytic Apps. We concluded by learning how to package an app and all its dependencies for easy sharing.
Now, we shift gears to an entirely new and powerful capability within Alteryx: Spatial Analytics. This lesson is the first step into that world, and it addresses the learning outcome: Identify spatial data types (points, lines, polygons) within Alteryx.
Over the next ~60 minutes, we will explore the fundamental building blocks of all spatial analysis. You will learn what spatial data is, how to recognize the three core object types, and how Alteryx represents and works with this kind of information. This foundation is essential for everything that follows, from mapping customer locations to analyzing trade areas.
1. The Building Blocks of Spatial Data
At its core, spatial data is information that describes the position, shape, and size of objects on the Earth's surface. In the world of data analytics, we simplify these complex geographic features into three basic types.
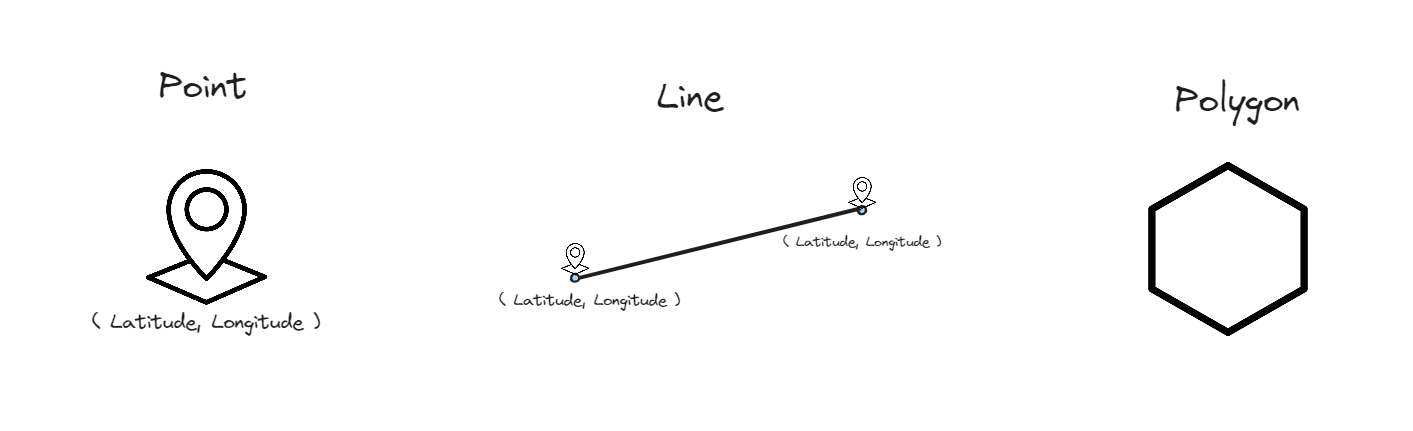
These three object types are:
- Points: A point represents a single, specific location defined by a pair of coordinates (typically latitude and longitude).
- Think of: A store location, a customer's address, the epicenter of an earthquake, or a traffic camera.
- Lines: A line (or polyline) represents a path connecting a sequence of points in a specific order.
- Think of: A road, a river, a flight path, or a delivery route.
- Polygons: A polygon represents an enclosed, two-dimensional area. It's essentially a line that connects back to its starting point to form a boundary.
- Think of: A city boundary, a sales territory, a national park, or a lake.
To get the official definitions and see how these concepts are introduced in the context of Alteryx, let's start with a short reading.
Spatial Analysis in Alteryx Part 1: The Basics - Points, Lines, and Polygons
This article from The Data School blog provides a very clear and concise introduction to the basic spatial object types.
Please read the first few paragraphs of the article, down to the end of the numbered list defining Points, Lines, and Polygons.
2. Spatial Objects in Alteryx
Now that you understand the concepts, how does Alteryx handle this type of data?
Alteryx has a special data type called a Spatial Object. When you work with spatial data, you will see a field in your data stream (often named SpatialObj, Centroid, or something similar) that contains these objects. Unlike a string or a number, you can't see the "value" of a spatial object directly in the Results grid. Instead, you'll see a label like Polygon or Point followed by an identifier.

The real power comes from visualizing these objects. The Browse tool, which you've used to view data, has a Map tab that automatically renders any spatial objects in your data stream. This is your primary window into the geographic dimension of your data.
Creating Spatial Objects
While you will often import data that already contains spatial objects, it's also common to create them yourself from standard data fields. This is a critical skill for the Advanced Certification.
Let's look at how the fundamental spatial tools in Alteryx work together to build these objects.
Spatial Analysis in Alteryx Part 1: The Basics - Points, Lines, and Polygons
Let's return to the Data School article to see the practical application. This reading will introduce you to the tools used to create points from coordinates and then build lines or polygons from those points.
In the article you opened earlier, please do the following: Skip the section about the 'Map Input tool'. Start reading from the heading 'Points can also be generated...'. This section explains the Create Points tool. Continue reading the next section about the Poly-Build tool, which shows how lines and polygons are constructed. Focus on the purpose of each tool and the kind of data they require to function.
Key Tools and Concepts
Based on the reading, let's summarize the key takeaways:
-
The Create Points Tool: This is the most fundamental spatial tool. It takes two numeric fields from your dataset—typically longitude and latitude—and uses them to generate a new Point spatial object for each row. As you saw in the example, this is how you turn a simple list of addresses or locations into something you can map.
-
The Poly-Build Tool: This tool demonstrates the relationship between the object types. It takes existing spatial objects (usually points) and assembles them into more complex shapes.
- To build Lines, the tool needs a field to group the points by (e.g.,
Bus Route ID) and a sequence field to know the correct order to connect them. - To build Polygons, it uses similar logic, connecting points in a sequence to form a closed shape.
- To build Lines, the tool needs a field to group the points by (e.g.,
Understanding this hierarchy—that lines and polygons are built from an ordered collection of points—is a core concept in spatial analytics.
Conclusion
In this lesson, we laid the groundwork for our exploration of spatial analytics in Alteryx. You now have the essential vocabulary and conceptual understanding to move forward.
Key Takeaways:
- There are three fundamental spatial data types: Points (single locations), Lines (paths), and Polygons (areas).
- Alteryx uses a special Spatial Object data type to store this information within a workflow.
- You can identify the type of spatial object in the Results window and visualize it using the Map tab of the Browse tool.
- The Create Points tool is used to generate point objects from coordinate data (latitude/longitude).
- The Poly-Build tool can construct lines and polygons by connecting a sequence of points.
This lesson focused on what spatial objects are. In our next session, we will focus on getting them into Alteryx. We'll cover the next logical step: Import and correctly configure spatial data from various file formats (e.g., shapefiles).