Hello! Welcome to the next lesson in our module on Applied Spatial Analytics.
In our last session, we used the Spatial Match tool to answer the question, "Which customers are inside my trade area?" We successfully identified and tagged records based on their location. However, this is only half the story. The next logical business question is often, "How many customers are in my trade area?" or "What are their total sales?"
Today, we will learn how to answer these kinds of aggregation questions. While you could follow a Spatial Match with a Summarize tool, Alteryx offers a more powerful and versatile tool designed for manipulating spatial objects themselves, which is essential for more complex aggregation scenarios.
Learning Outcome: Aggregate data within geographic regions using the Spatial Process tool.
We will focus on the Spatial Process tool, exploring how its different actions allow us to combine, cut, and intersect spatial objects to prepare our data for powerful geographic summarization.
1. The Role of the Spatial Process Tool
The Spatial Process tool is a bit like a Swiss Army knife for spatial objects. It takes two spatial inputs (which can be individual objects or streams of objects) and performs a geometric operation to create a new spatial object output.
It has five distinct actions that determine how the two inputs interact. To get a clear definition of these actions, let's start with a brief reading.
Comprehensive Guide to Spatial Analysis in Alteryx ‒ Part 1
This guide from The Data School provides a concise overview of the entire spatial tool palette. We'll focus on its description of the Spatial Process tool.
Please read the short description for the 'Spatial Process' tool, which you'll find under the 'Spatial Palette Tools' heading. Pay attention to the five different actions it can perform on two spatial objects.
As you just read, the five actions are:
- Combine Objects: Merges all input objects into a single, unified object.
- Cut 1st from 2nd: Creates an object that is the second object with the first object's area removed.
- Cut 2nd from 1st: Creates an object that is the first object with the second object's area removed.
- Create Intersection Object: Creates a new object representing only the area where both input objects overlap.
- Create Inverse Intersection Object: Creates a new object representing only the areas where the objects do not overlap.
For the purpose of aggregating data, the two most important actions to master are Combine Objects and Create Intersection Object.
2. Use Case 1: Combining Regions for Unified Analysis
Imagine you have several overlapping trade areas for stores in the same city. Before analyzing the total market, you might want to treat this entire area as one large region. The Combine Objects action is perfect for this. It takes all the input polygons and dissolves the internal boundaries, creating a single, clean polygon of the total area.
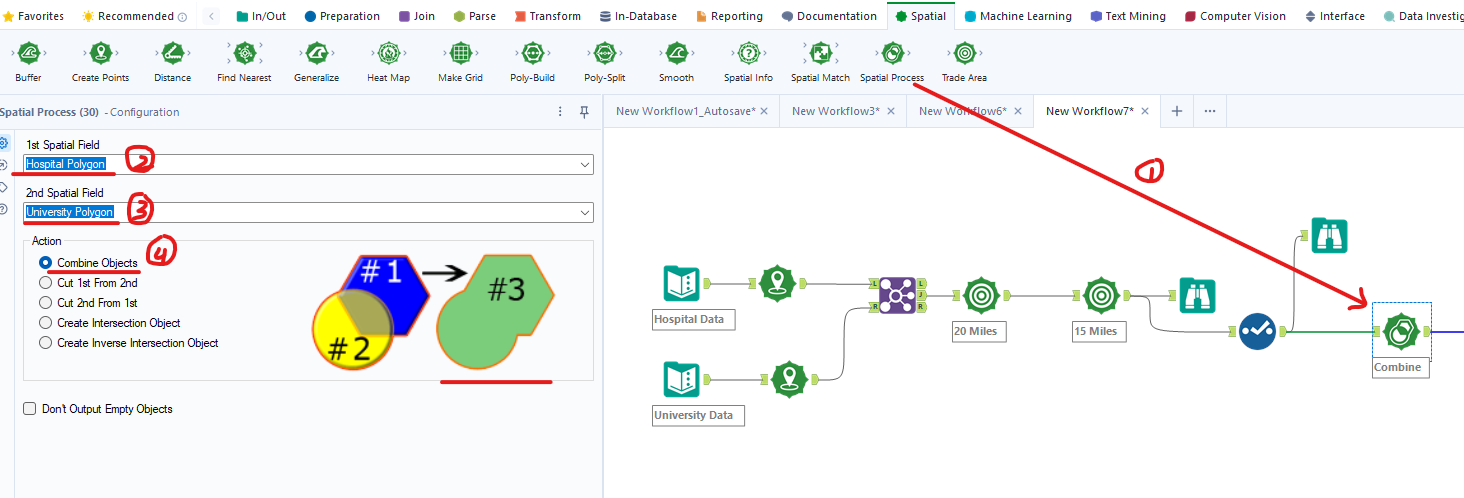
This action is used to aggregate the geographies themselves before you analyze the data within them.
3. Use Case 2: Aggregating Data via Intersection
This is the most powerful application of the Spatial Process tool for our learning goal. The Create Intersection Object action is the key to a technique called spatial apportionment (or areal interpolation).
Let's consider a common business scenario:
- You have a polygon representing a 10-minute drive-time trade area around your store.
- You have demographic data (like population or household income) aggregated at the ZIP Code level (as polygons).
A simple Spatial Match would tell you that your trade area intersects several ZIP Codes, but it wouldn't tell you how much it intersects them. Your trade area might cover 90% of one ZIP Code but only 5% of another. Simply summing the population of all intersected ZIP Codes would be highly inaccurate.
This is where Spatial Process comes in.
- Find the Overlap: You use
Spatial Processwith theCreate Intersection Objectaction. The inputs are your trade area polygon and the ZIP Code polygons. The output is a set of new, smaller polygons representing the exact areas where the trade area and ZIP codes overlap. - Calculate Proportion: Using the
Spatial Infotool, you can calculate the area of these new intersection polygons. By comparing the intersection area to the original ZIP Code's total area, you can find the proportion of the ZIP Code that falls within your trade area. - Apportion the Data: You then multiply the total population of the ZIP Code by this proportion. If 40% of a ZIP Code's area is within the drive-time, you can estimate that 40% of its population is too.
This method allows for a much more accurate estimation of data within a custom-defined region.
The importance of the intersection action is a common theme in spatial analysis workflows.
Spatial tool palette in Alteryx: Part I
Let's quickly look at another resource that highlights the importance of the intersection function.
Please read the section on 'The Spatial Process tool'. Notice how it specifically calls out that the 'create intersection' action is frequently used to understand relationships between spatial data.
4. Hands-On Practice: Estimating Overlapping Population
Let's build a workflow to apply the concept of spatial apportionment.
Scenario: Two retail stores, "Store A" and "Store B," have circular trade areas defined by a 2-mile radius. We know the total potential customer count within each full trade area. We need to estimate the number of potential customers in the overlapping "shared" market zone, assuming customer density is uniform.
-
Create Store Points:
- Add a Text Input tool. Create two records, one for each store, with Latitude and Longitude.
StoreName Lat Lon Customers Store A 40.75 -73.99 10000 Store B 40.76 -73.97 8000 - Add a Create Points tool to convert these records into spatial point objects.
- Add a Text Input tool. Create two records, one for each store, with Latitude and Longitude.
-
Create Trade Areas:
- Add a Buffer tool after
Create Points. - Configure it to create a buffer of 2 miles around each store's
SpatialObj. This creates the two circular trade area polygons.
- Add a Buffer tool after
-
Isolate Each Trade Area:
- We need to process each trade area separately to get its total area. Add a Filter tool after the
Buffer. - Configure it to
[StoreName] = "Store A". - Add another Filter tool from the same
Buffertool output. Configure it to[StoreName] = "Store B". You now have two separate streams.
- We need to process each trade area separately to get its total area. Add a Filter tool after the
-
Find the Intersection:
- Add a Spatial Process tool.
- Connect the 'True' output of the "Store A" filter to the left (
1) input. - Connect the 'True' output of the "Store B" filter to the right (
2) input. - In the configuration, select the Create Intersection Object action.
-
Calculate Areas:
- Add a Spatial Info tool connected to the output of the
Spatial Processtool. Check the box for Area (Square Miles). This will give you the area of the intersection. - Add another Spatial Info tool connected to the 'True' output of the "Store A"
Filtertool (before it goes into Spatial Process). Also, check Area (Square Miles). This gives you the total area of Store A's trade area.
- Add a Spatial Info tool connected to the output of the
-
Join the Areas Together:
- Add a Join tool. Connect the output of the "Intersection"
Spatial Infotool to the left (L) input. - Connect the output of the "Store A"
Spatial Infotool to the right (R) input. - Since there's no common field to join on, go to the configuration pane and uncheck all join fields. This will perform a Cartesian join, which is fine here since each input stream only has one record.
- Add a Join tool. Connect the output of the "Intersection"
-
Estimate the Population:
- Add a Formula tool after the
Join. - Create a new column called
Intersection_Customers. - The formula will be
([AreaSqMiles_L] / [AreaSqMiles_R]) * [Customers_R]. This calculates the ratio of the intersection area to Store A's total area, then multiplies it by Store A's total customer count.
- Add a Formula tool after the
-
Add Browse tools after the
Formulatool and theSpatial Processtool to examine your final number and visualize the intersection polygon.
You have now successfully used spatial apportionment to estimate a value within an aggregated geographic region!
Conclusion
In this lesson, you moved beyond simply identifying objects within an area to actually aggregating and estimating data within complex geographic boundaries. You learned how the Spatial Process tool is essential for this task.
Key Takeaways:
- The Spatial Process tool manipulates spatial objects by performing geometric operations like combining them or finding their intersection.
- The
Combine Objectsaction is used to merge multiple polygons into a single, unified region. - The
Create Intersection Objectaction is the foundation for spatial apportionment, a powerful technique to estimate data within a specific area of overlap. - Spatial apportionment involves finding the intersection, calculating its proportional area relative to a larger known area, and applying that proportion to the data you want to estimate.
Preview of the Next Lesson:
So far in this module, we have created trade areas (Trade Area tool), found what's inside them (Spatial Match), and now learned how to aggregate data within them (Spatial Process). In the next lesson, we will put all these skills together to solve a complete business problem: conducting a site selection analysis to find the best location for a new store.