Hello! Welcome to the second module of our course.
In the last lesson, we established that real-world components and PCB layouts are full of parasitic inductances and capacitances. You learned that a MOSFET, for instance, has an internal drain-source capacitance () and that the physical layout creates parasitic loop inductance. These are not just minor imperfections; they are central to the challenges of power converter design.
Today, we will connect the existence of these parasitics to a major source of inefficiency: hard switching loss. Your goal for this lesson is to explain how the simultaneous presence of voltage and current across a switch during its transitions leads to significant power dissipation. This is the fundamental problem that Zero Voltage Switching (ZVS) aims to solve, so a solid understanding here is crucial.
What is Hard Switching?
In an ideal world, a switch would turn on and off instantaneously. It would go from blocking all voltage (but with zero current) to conducting all current (but with zero voltage across it) in no time. In this ideal case, the power dissipated () would always be zero.
Hard switching refers to the real-world scenario where we simply force the switch on and off without any special circuitry to manage the transition. Because the switch takes a finite time to change states, there is a period where both the voltage across it and the current through it are non-zero. This overlap is the source of switching loss.
Let's begin by reading a short article that introduces this concept and provides an excellent visual.
Minimizing Losses with Hard or Soft Switching
This article from EDN, titled 'Minimizing Losses with Hard or Soft Switching', provides a concise definition of hard switching.
Please read the introduction and the section titled 'Hard switching'. Pay close attention to Figure 2. It shows three waveforms: drain voltage (blue), drain current (red), and the resulting dissipated power (green). Notice how the green power curve peaks precisely where the red and blue curves cross over.
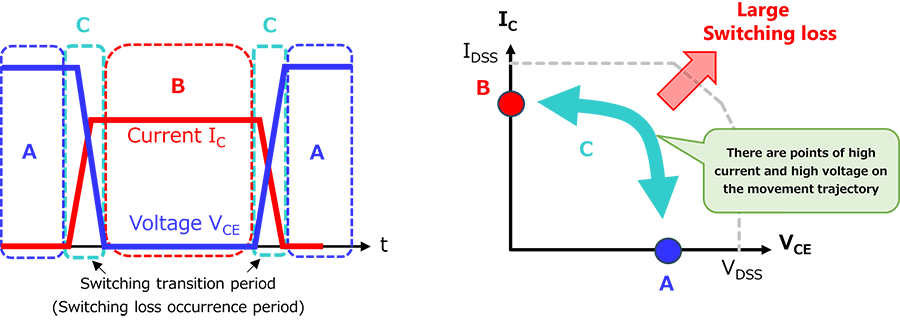
The key insight from that article is that power is dissipated during the transition. The following image breaks this down even further, showing the distinct phases of the turn-on and turn-off events.

The Switching Process in Detail
To understand why this overlap occurs, we need to look at the sequence of events during the turn-on and turn-off transitions. The internal capacitances of the MOSFET, which we discussed in the last lesson, play a starring role.
This next video provides a clear, step-by-step walkthrough of what happens inside a MOSFET as it switches an inductive load.
Power Electronics - Switching Losses in a MOSFET
In this video, 'Power Electronics with Dr. K', the presenter breaks down the turn-on and turn-off processes, explaining the behavior of the gate voltage, drain voltage, and drain current.
Please watch from 1:44 to 8:56. For the turn-on section (1:44 - 5:14), focus on how the current rises before the voltage falls. For the turn-off section (5:14 - 8:56), notice the reverse: the voltage rises before the current falls. In both cases, this creates an overlap where significant power is dissipated.
To summarize the video's key points:
- Turn-on: The gate voltage rises, turning the MOSFET on. The current begins to ramp up to the full load value. Only after the current has reached its peak does the drain-source voltage begin to fall to its low on-state value. During the time when current is rising and voltage is still high, power is lost.
- Turn-off: The process happens in reverse. The gate voltage falls, and the drain-source voltage begins to rise. Only after the voltage has reached the input voltage level does the drain current begin to fall. Again, there's a period where both voltage and current are high, causing power loss.
We can also visualize this on a current-voltage (I-V) plot. An ideal switch would just "teleport" between the ON state (high current, zero voltage) and the OFF state (zero current, high voltage). A hard-switched, real switch has to travel along a path between these two points, and this path traverses a region of high power dissipation.
From Instantaneous Spikes to Average Power Loss
The power spikes we've seen exist only for a few tens or hundreds of nanoseconds. However, they occur every single time the switch turns on or off. The total energy lost is the area under those power spikes. To find the average power loss, we multiply the energy lost per cycle by the number of cycles per second (the switching frequency).
Let's look at a simplified derivation. If we approximate the switching power waveforms as triangles, the area of each triangle (the energy) is roughly .
- Height: The peak power, which is .
- Base: The switching time ( or ).
So, the energy lost during one turn-on and one turn-off is:
The average power loss, , is this energy multiplied by the switching frequency, :
This equation is fundamental. It tells us that switching loss is directly proportional to the switching frequency. This creates a core conflict in power supply design: designers want to increase frequency to use smaller inductors and capacitors (improving power density), but doing so directly increases switching losses and reduces efficiency. This is the trade-off that motivates the move to soft-switching topologies like ZVS.
Test your understanding!
A buck converter is operating at 100 kHz with an input voltage of 48V and a load current of 5A. It has a measured switching loss of 2W.
The designer decides to increase the switching frequency to 300 kHz to reduce the size of the inductor. Assuming the switching transition times ( and ) remain the same, what would be the new estimated switching loss?
Show answer
The new estimated switching loss would be 6W.
Since switching loss is directly proportional to the switching frequency (), tripling the frequency from 100 kHz to 300 kHz will also triple the switching loss, assuming all other factors (voltage, current, transition times) remain constant.
This illustrates the significant thermal penalty for increasing switching frequency in a hard-switched converter.
A Deeper Dive: Gate Drive and Practical Trade-offs
The switching times, and , are not fixed values. They are determined by how quickly the gate of the MOSFET can be charged and discharged. This speed is controlled by the gate driver circuit, most simply by a gate resistor.
You might think the solution is to use a very small gate resistor to switch as fast as possible. While this does reduce switching loss, it can create other problems. A very fast turn-on can worsen the effects of diode reverse recovery (an effect in the other switch in the half-bridge) and cause severe voltage ringing and electromagnetic interference (EMI).
This video demonstrates this exact trade-off by simulating a circuit with different gate resistors.
MOSFET switching losses: Explanation and demonstration by simulation
This video by Dr. Sam Ben-Yaakov, 'MOSFET switching losses', provides an excellent demonstration of a real-world design trade-off.
Please watch from 15:30 to 18:47. The presenter compares two scenarios: one with slow switching (40Ω resistor for both turn-on and turn-off) and one with fast switching (20Ω for turn-on, 5Ω for turn-off). Observe the dramatic difference in the energy loss curves. Pay attention to his final conclusion about why you might want a slower turn-on but a faster turn-off.
This highlights a key point for practical PCB reviews: the choice of gate drive components is a deliberate compromise between efficiency (low switching loss) and electrical integrity (low ringing and EMI).
Conclusion
In this lesson, you've learned about the central problem that modern power converters are designed to overcome.
Key Takeaways:
- Hard switching is the process of turning a switch on or off while there is simultaneously voltage across it and current through it.
- Because real switches have a finite transition time, this results in an overlap of the voltage and current waveforms.
- During this overlap, significant instantaneous power is dissipated in the switch ().
- The average switching power loss is proportional to the operating voltage, current, transition times, and most importantly, the switching frequency.
- This creates a fundamental trade-off between operating frequency (for smaller size) and efficiency.
You now understand the "what" and "why" of hard switching losses. In our next lesson, we will build on this by learning how to calculate these losses using parameters found directly in a MOSFET datasheet. This will give you the quantitative tools needed to evaluate the severity of this problem in a given design and to fully appreciate why ZVS is such an effective solution.