Hello! In our previous lesson, we learned how to organize our code into reusable blocks called functions. This ability to create abstractions is a cornerstone of building larger, more complex programs. However, with increased complexity comes a greater chance of introducing errors, or "bugs." Simply staring at the code often isn't enough to find them.
This lesson is dedicated to the essential skill of debugging. Our goal is to learn how to read Python error messages and use a debugger to trace simple programs. We will explore two complementary approaches. First, we'll learn to interpret the "clues" Python gives us when something goes wrong—these are called tracebacks. Then, we'll move on to a more powerful technique: using a debugger to step through our code like a detective, observing its behavior line by line. Mastering these skills will transform debugging from a frustrating guessing game into a systematic and even satisfying process of problem-solving.
1. Reading the Clues: Understanding Python Tracebacks
When your program crashes, Python doesn't just give up. It provides a detailed report called a traceback (also known as a stack trace). This report shows the exact sequence of function calls that led to the error. Your first instinct might be to feel overwhelmed by the text, but learning to read it is a critical first step in debugging.
A traceback provides three key pieces of information:
- The type of error that occurred (e.g.,
NameError,TypeError). - A message with more details about the error.
- The specific file and line number where the error happened.
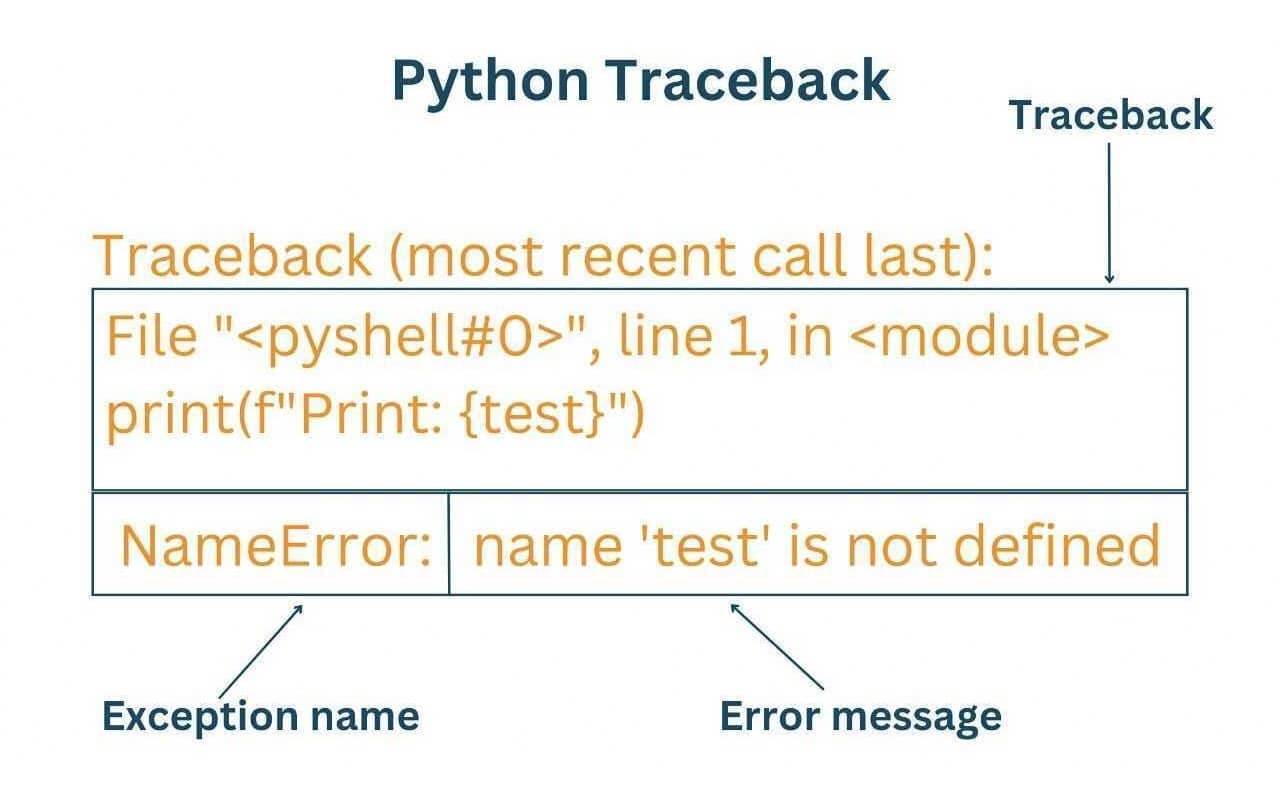
The most effective way to read a traceback is from the bottom up. The last line tells you what happened, and the lines above it tell you how the program got there.
Let's dive into a more detailed guide on how to interpret these reports.
Understanding the Python Traceback
This article from Real Python provides an excellent, structured overview of how to read a traceback. It will give you a solid framework for approaching error messages.
Please read the section titled "How Do You Read a Python Traceback?". Pay close attention to the bottom-up reading strategy and the breakdown of the different colored boxes in their diagram (error message line, function calls, and the executed code).
To see this process in action, the following video walks through fixing several common errors by interpreting their tracebacks.
Debugging with stack traces | Intro to CS - Python | Khan Academy
This Khan Academy video provides a great visual demonstration of reading and responding to error messages for different kinds of bugs, including SyntaxError and IndentationError.
Please watch from the beginning until the end of the SyntaxError example. Notice how the presenter uses the traceback to identify the exact line and cause of the error, and even uses a search engine to understand an unfamiliar error message—a very common practice for all programmers!
Common Error Types
You will encounter certain types of exceptions very frequently. Familiarizing yourself with them will help you pinpoint problems much faster. The Real Python article you just looked at has a great section covering these.
Understanding the Python Traceback
This part of the article serves as a reference for the most common errors. You don't need to memorize them all, but reading through them will help you recognize them in the future.
Please read the section "What Are Some Common Tracebacks in Python?", focusing on AttributeError, IndexError, KeyError, NameError, and TypeError. For each one, try to understand the example so you can see what kind of mistake leads to that specific error.
Here's a quick summary of the errors you just read about:
NameError: You tried to use a variable or function name that hasn't been defined yet. This is often caused by a typo.TypeError: You tried to perform an operation on a value of the wrong type, like adding a number and a string (1 + "hello").IndexError: You tried to access an element in a list using an index that is outside the valid range (e.g., asking for the 10th item in a list that only has 5 items).KeyError: Similar toIndexError, but for dictionaries. You tried to access a key that doesn't exist in the dictionary.AttributeError: You tried to access a method or attribute on an object that doesn't have it (e.g., calling.append()on a tuple, which is immutable).
2. The Interactive Investigation: Using a Debugger
Tracebacks are fantastic for finding the location of a crash. But what about errors in logic, where the code runs but produces the wrong result? Or what if you're not sure how a variable's value is changing inside a loop? For this, we need a more powerful tool: a debugger.
A debugger allows you to pause your program at any point and inspect its state. Instead of guessing what's happening by adding print() statements, you can watch it happen live. The VS Code editor you have set up has a powerful built-in debugger.
The core concepts of debugging are:
- Breakpoints: A marker you place on a line of code where you want the debugger to pause execution.
- Stepping: Once paused, you control the program's execution one step at a time.
- Step Over (F10): Executes the current line and moves to the next one. If the line contains a function call, it executes the entire function without going inside.
- Step Into (F11): If the current line is a function call, this moves the execution point inside that function, allowing you to debug it.
- Step Out (Shift+F11): Finishes executing the current function and returns to the line where it was called.
- Continue (F5): Resumes normal execution until the program ends or hits another breakpoint.
- Variable Inspection: While paused, you can see the current values of all variables in your program.

The following video provides a clear, practical introduction to using these features in VS Code.
How to Use a Debugger - Debugger Tutorial
This video by Tech With Tim is a fantastic walkthrough of the debugging process. It contrasts debugging with using print() statements and clearly demonstrates the main controls.
Please watch these two key segments: What a debugger is and how it works: This part introduces the core idea of breakpoints and inspecting variables. Stepping through code: This segment explains and demonstrates the crucial "step over," "step into," "step out," and "continue" commands.
3. Putting It All Together: A Practical Example
Let's apply these concepts to fix a small, buggy program. Here is a function that is supposed to calculate the average grade for a list of students, excluding any who scored 0.
Copy this code into a new file in VS Code (e.g., grade_analyzer.py):
def calculate_class_average(student_grades):
    """
    Calculates the average grade for a list of student grades.
    Excludes any grades of 0 from the calculation.
    """
    valid_grades = []
    for grade in student_grades:
        if grade > 0:
            valid_grades.add(grade) # Bug 1 is here

    total = sum(valid_grades)
    average = total / len(valid_grades) # Bug 2 might happen here


    # Let's find the student who is exactly one position
    # before the last student in the original list.
    target_student_index = len(student_grades) - 1
    target_grade = student_grades[target_student_index] # Bug 3 is here

    print(f"The target student's grade is: {target_grade}")
    return average

grades = [95, 88, 0, 75, 100]
class_avg = calculate_class_average(grades)
print(f"The class average is: {class_avg}")
Step 1: Fix the AttributeError using the Traceback
Run the script. It will immediately crash. Look at the traceback in your terminal.
- What is the error type? You should see
AttributeError. - What is the message? It will say something like
'list' object has no attribute 'add'. - Where is it? The traceback will point to the line
valid_grades.add(grade).
This tells you that you are trying to use a method called .add() on a list, but lists don't have that method. The correct method to add an item to a list is .append().
Fix: Change valid_grades.add(grade) to valid_grades.append(grade).
Step 2: Fix the IndexError using the Debugger
Save the fix and run the script again. This time, imagine the input was different. Change the grades list to grades = [90]. Now run it. It crashes again!
The traceback shows an IndexError. The error message is list index out of range and it points to target_grade = student_grades[target_student_index]. This means target_student_index has a value that isn't a valid index for the student_grades list. But why?
Let's use the debugger to find out.
- Set a breakpoint: Click in the margin to the left of the line
target_student_index = len(student_grades) - 1. A red dot should appear. - Start debugging: Press F5 (or click the green play button in the "Run and Debug" panel). The program will run and pause at your breakpoint.
- Inspect and Step:
- Hover your mouse over
student_grades. A tooltip will show you its value:[90]. - Press Step Over (F10). The yellow highlight moves to the next line.
- Now hover over
target_student_index. You will see its value is0. - The next line tries to access
student_grades[0]. This seems fine.
- Hover your mouse over
Let's try the other failing case. Stop the debugger (red square button). Change the grades list back to grades = [] (an empty list). Start the debugger again (F5).
- Execution pauses at your breakpoint. Hover over
student_grades. It's[]. - Press Step Over (F10).
- Hover over
target_student_index. Its value is-1. - The next line tries to access
student_grades[-1]. While negative indexing is valid in Python, it's not valid for an empty list. This is the source of ourIndexError. The logic fortarget_student_indexdoesn't account for lists with fewer than two elements.
Fix: A simple way to fix this is to make sure we only perform this calculation if the list is long enough. Wrap the last few lines in an if statement.
    # ... inside the function, after calculating the average
    if len(student_grades) > 1:


        # Let's find the student who is exactly one position
        # before the last student in the original list.
        target_student_index = len(student_grades) - 2 # Logic Bug corrected
        target_grade = student_grades[target_student_index]
        print(f"The target student's grade is: {target_grade}")
Notice I also corrected a logic bug: "one position before the last student" is at index len - 2, not len - 1. The debugger helps you think through these details!
Conclusion
In this lesson, you've acquired two of the most important practical skills in a programmer's toolkit. You are no longer flying blind when your code breaks.
Here are the key takeaways:
- Tracebacks are your first line of defense. Read them from the bottom up to quickly identify the type and location of an error.
- Common exceptions (
TypeError,NameError, etc.) have predictable causes. Recognizing them will speed up your debugging. - A debugger is your microscope for code. It lets you pause execution with breakpoints, control the flow with stepping commands, and inspect variables to understand your program's state.
- Debugging is a systematic process: read the error, form a hypothesis, use the debugger to test it, and apply a fix.
We've now completed our introductory module on Python programming. You've gone from having no coding experience to being able to write scripts with variables, loops, conditionals, and functions, and you now have the skills to find and fix your own bugs.
In our next module, we will shift gears slightly. We will begin our study of Discrete Mathematics, starting with propositional logic. This might seem like a big jump, but this field is the very foundation of how computers "think" and how we construct logical arguments in code. It provides the theoretical underpinning for much of what you've just learned to do in practice.