Introduction
Welcome back! In our last lesson, we learned how to react to problems after they occur by interpreting error messages and using toggle-debug-on-error to get a backtrace. This is an essential skill for understanding why a program failed.
Today, we shift from a reactive to a proactive approach. We will explore one of the most fundamental and powerful debugging techniques in any programming language: printing information as your code executes. In Elisp, the primary tool for this is the message function.
The goal of this lesson is to learn how to use the message function to print debugging information to the *Messages* buffer. By strategically placing message calls in your code, you can create a trail of "breadcrumbs" to follow. This allows you to inspect the values of variables, confirm which parts of your code are being run, and understand your program's flow of execution—often revealing logical errors before they even cause a crash. This technique will be invaluable as you start writing more complex functions to customize your Emacs workflow.
1. The message Function: Your Window into Execution
At its simplest, message is a function that displays a string to the user. It has two key behaviors:
- It prints the string to the echo area (the single line at the bottom of your Emacs frame, also called the minibuffer).
- It appends the string to a special buffer called
*Messages*, creating a persistent log.
Let's start by exploring the basics with a guide from Protesilaos Stavrou, a well-known figure in the Emacs community.
This article, 'Emacs Lisp Elements', provides a comprehensive overview of Elisp fundamentals. We'll begin with its initial introduction to message.
First, read the section 'Basics of how Lisp works' until you reach the code block for (upcase ...). Focus on the first example using message and the explanation that its output goes to the *Messages* buffer. Then, jump to the section 'Symbols, balanced expressions, and quoting' and read about the my-greet-person function. Note how it explains that you can view the *Messages* buffer with C-h e (view-echo-area-messages).
As you just read, you can run a simple expression like (message "Hello from Elisp!") in your *scratch* buffer (using C-x C-e) to see the output.
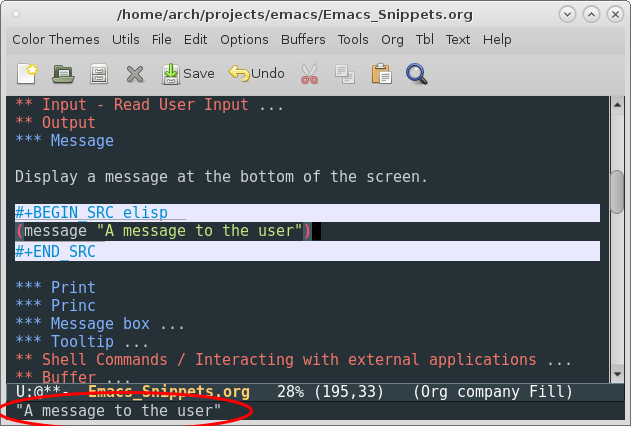
After running a few message calls, press C-h e to open the *Messages* buffer. You'll see a complete history of all the messages you've generated. This log is the real treasure for debugging.
Formatting Messages to Inspect Variables
Printing static strings is useful, but the real power of message comes from its ability to display the values of variables. Like many printing functions in other languages, message uses a format string with special placeholders.
The most common placeholder is %s, which stands for "string". It tells message to take the next argument and format it as a string.
For example:
(let ((user-name "Kal")
      (items-processed 42))
  (message "User %s has processed %s items." user-name items-processed))
When you evaluate this, Elisp will replace the first %s with the value of user-name and the second %s with the value of items-processed. The output will be: User Kal has processed 42 items.
Other useful format specifiers include:
%d: for an integer.%f: for a floating-point number.%S: for an S-expression, which prints the Elisp object in a readable form (e.g., a list will be shown with parentheses).
2. A Case Study: Debugging with message
Now let's see how message can be used to solve a real bug. The following video provides a perfect, unscripted example of a programmer using message to diagnose an issue.
The function in question is supposed to count the words in a buffer.

Watch how the creator uses the output from message to realize his function isn't working and then identify the typo causing the problem.
Elisp Tutorial - Part 4 Interactive Functions
In this segment from his Elisp Tutorial, Goparism builds a word-counting function and inadvertently demonstrates a classic debugging scenario.
Watch from 4:30 to 6:29. First, notice how he constructs the message call using format to build the final string. Then, pay close attention to the moment he runs the function and gets 'Words in Buffer: 0'. See how this immediate feedback from message allows him to quickly scan his code and spot the typo. This is message-driven debugging in action.
This short clip perfectly illustrates the "print debugging" workflow:
- Run the code.
- Observe an incorrect output via
message. - The incorrect output narrows down where the problem might be.
- Inspect the code in that area, find the bug, and fix it.
- Run the code again and see the correct output from
message, confirming the fix.
3. Practical Application: Instrumenting a Function
Let's apply this technique by writing and instrumenting a new function. Imagine you want an interactive command that finds all numbers in the current region and calculates their sum.
Here is a first draft of such a function. It introduces a new function, re-search-forward, which searches for a regular expression. The pattern "\\b[0-9]+\\b" matches sequences of one or more digits that form a whole word.
(defun sum-numbers-in-region (start end)
  "Find all numbers in the region and calculate their sum."
  (interactive "r")
  (save-excursion
    (goto-char start)
    (let ((total 0))
      (while (re-search-forward "\\b[0-9]+\\b" end t)
        (let* ((match-str (match-string 0))
               (match-num (string-to-number match-str)))
          (setq total (+ total match-num))))
      (message "The total is: %d" total))))
Your Task:
- Copy the function above into your
*scratch*buffer and evaluate it withC-x C-e. - Open a new buffer. Type some text containing numbers, for example:
I bought 3 apples, 10 oranges, and 12 bananas for a party of 5. - Select the region containing the text.
- Run your new command with
M-x sum-numbers-in-region.
You should see the message The total is: 30 in the echo area. It worked! But what if it hadn't? How could we have debugged it?
Let's "instrument" the function by adding message calls inside the loop to trace its execution. This is like opening up the engine while it's running.
Modify your function to look like this:
(defun sum-numbers-in-region-debug (start end)
  "Find all numbers in the region and calculate their sum (with debug messages)."
  (interactive "r")
  (save-excursion
    (goto-char start)
    (let ((total 0))
      ;; --- Message before the loop ---
      (message "Starting search in region from %d to %d" start end)

      (while (re-search-forward "\\b[0-9]+\\b" end t)
        (let* ((match-str (match-string 0))
               (match-num (string-to-number match-str)))

          ;; --- Message inside the loop ---
          (message "Found number: '%s' (%d). Current total: %d" match-str match-num total)

          (setq total (+ total match-num))))

      ;; --- Message after the loop ---
      (message "The final total is: %d" total))))
Now, evaluate this new function, select the same text, and run M-x sum-numbers-in-region-debug.
This time, nothing will appear in the echo area except the final message. But if you open the *Messages* buffer with C-h e, you will see a detailed trace of the entire process:
Starting search in region from 1 to 65
Found number: '3' (3). Current total: 0
Found number: '10' (10). Current total: 3
Found number: '12' (12). Current total: 13
Found number: '5' (5). Current total: 25
The final total is: 30
This trace tells you exactly what the function did at each step: what it found, what value it converted it to, and what the running total was before adding the new number. If the final sum were wrong, you could pinpoint exactly where the calculation went awry.
Conclusion
You now have a powerful, proactive tool in your debugging arsenal. While interpreting errors tells you where your code broke, using message tells you what your code is doing. It's an indispensable technique for building and testing new functionality.
Key Takeaways:
- The
messagefunction prints a string to the echo area and logs it permanently in the*Messages*buffer. - You can view the message log at any time with
C-h e. - Use format specifiers like
%s(string),%d(integer), and%S(S-expression) to print the values of variables. - The core debugging strategy is to insert
messagecalls at key points in your code to trace the flow of execution and inspect the state of variables.
Preview of the Next Lesson
Placing message calls is effective, but it requires you to modify your source code. For more complex problems, you might want to pause execution and inspect your program's state "live" without adding print statements everywhere.
In the next lesson, we will explore the Edebug interactive debugger. You will learn how to step through your code line by line, examine variable values on the fly, and truly dissect your program's behavior as it happens. This will build upon what we learned about toggle-debug-on-error and give you the most powerful debugging tool in the Emacs Lisp ecosystem.