Introduction
Welcome back! In the last lesson, we focused on reactive debugging. You learned how to use toggle-debug-on-error to automatically enter the debugger when an error occurs, allowing you to inspect the call stack in the *Backtrace* buffer. This is invaluable for understanding why something crashed unexpectedly.
However, what if your code runs without crashing but produces the wrong output? Or what if you simply want to understand the inner workings of a complex function? For this, we need a more proactive and interactive tool.
This lesson introduces you to Edebug, the source-level debugger for Emacs Lisp. Instead of waiting for an error, Edebug allows you to intentionally pause your code at any point and step through its execution, one expression at a time. This is like having a slow-motion camera for your code, giving you a detailed view of its logic, control flow, and data transformations. Mastering Edebug will give you the confidence and capability to dissect, understand, and build your own custom functions, which is central to your goal of extending Emacs.
1. What is Edebug?
The standard debugger we used previously activates after an error, showing you the backtrace. Edebug is different. It's a source-level debugger, meaning you interact with it directly within your source code buffer.
To use Edebug, you must first instrument the function you want to debug. Instrumentation is a process where Emacs injects special code into your function's definition in memory. This extra code doesn't change your source file, but it allows Edebug to hook into the evaluation process, pausing execution at specific points and giving you control.
The key capabilities of Edebug include:
- Stepping through code expression by expression.
- Setting breakpoints to pause execution at specific locations.
- Viewing the results of evaluated expressions in real-time.
- Displaying a backtrace at any point.
2. Instrumenting a Function for Edebug
The first step is always to instrument the code. The most common way to do this is with a prefix argument to the eval-defun command.
Let's use a simple function to see this in action. Copy the following code into your *scratch* buffer:
(defun generate-greeting (name)
  "Create a personalized greeting."
  (let ((hour (string-to-number (format-time-string "%H"))))
    (if (< hour 12)
        (format "Good morning, %s!" name)
      (format "Good afternoon, %s!" name))))
To instrument this function:
- Place your cursor anywhere inside the
defunform. - Press
C-u C-M-x(that'seval-defunwith a universal prefix argument).
The minibuffer will confirm that the function is instrumented for debugging by displaying generate-greeting. Now, any time you call this function, Edebug will activate.
Let's trigger it. Evaluate the following expression in your *scratch* buffer using C-x C-e:
(generate-greeting "Kal")
Immediately, your *scratch* buffer will become read-only, and you'll see a small arrow (=>) pointing to the beginning of the let form. This arrow marks the current execution point.
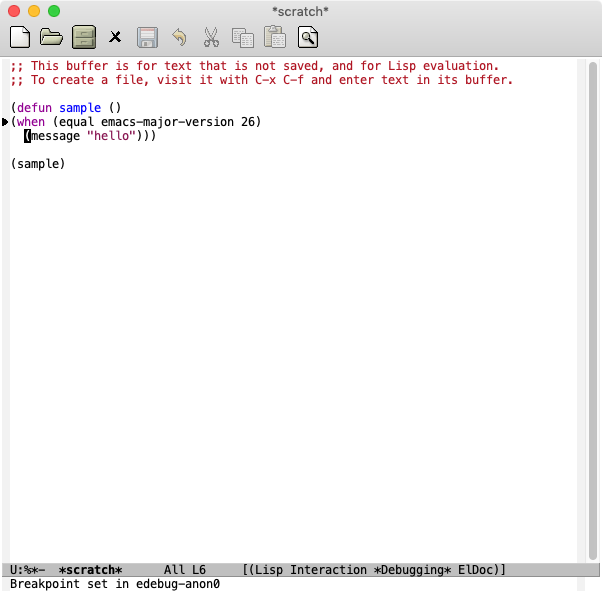
This is Edebug's main interface. You are now paused inside the function's execution.
3. Stepping Through Code Execution
Once you're inside Edebug, you can control the flow of execution. The most fundamental command is stepping.
The following video provides an excellent demonstration of instrumenting a function and stepping through it. Pay close attention to how the execution arrow moves and how the results of expressions are displayed in the echo area.
Learning To Use the Emacs Debugger - System Crafters Live!
This clip from the 'Learning To Use the Emacs Debugger' stream by System Crafters shows the core workflow of Edebug: instrumenting, stepping, and observing results.
Watch from 58:52 to 01:06:00. The presenter explains the difference between the basic debugger and Edebug, then demonstrates instrumenting a function with C-u C-M-x and stepping through it using the spacebar.
As you saw in the video, the primary commands for navigating Edebug are simple keystrokes:
| Key | Command | Description |
|---|---|---|
SPC |
edebug-step-mode |
Step to the next stop point. This is your main tool. It moves into and out of expressions. |
n |
edebug-next-mode |
Next expression. Steps over the current expression, which is useful for skipping the details of a function call. |
q |
top-level |
Quit Edebug and abort the execution, returning you to the top-level command loop. |
d |
edebug-backtrace |
Display a backtrace of the current call stack, similar to what you saw in the previous lesson. |
Try it now: With generate-greeting still paused in Edebug:
- Press
SPCrepeatedly. Watch how the arrow moves inside and then out of each S-expression. - Observe the echo area. After stepping over an expression (e.g.,
(format-time-string "%H")), its return value will be displayed. - Continue pressing
SPCuntil the function finishes execution. The return value of the entire function will be displayed, and you will exit Edebug.
To remove the instrumentation from a function, simply re-evaluate it without the prefix argument (i.e., with a normal C-M-x or C-x C-e).
4. Using Breakpoints to Control Flow
Stepping through every single expression can be tedious in a large function. Often, you want to run the code normally until it reaches a specific point of interest. For this, we use breakpoints.
A breakpoint is a marker that tells Edebug: "Run freely, but stop here."
Learning To Use the Emacs Debugger - System Crafters Live!
The same System Crafters video also demonstrates how to set and use breakpoints.
Watch from 01:38:43 to 01:42:06. The presenter shows how to set a breakpoint with the b key and then clear it with the u key.
Here are the key commands for working with breakpoints:
| Key | Command | Description |
|---|---|---|
b |
edebug-set-breakpoint |
Set a breakpoint at the stop point at or after the cursor. |
u |
edebug-unset-breakpoint |
Unset the breakpoint at the current location. |
g |
edebug-go-mode |
Go until the next breakpoint is hit (or the function ends). |
Let's try this with our generate-greeting function.
- If you've exited Edebug, re-enter it by evaluating
(generate-greeting "Kal")again. - Move your cursor to the
formatexpression inside theifform (the "Good morning" line). - Press
b. You should see a message in the minibuffer confirmingBreakpoint set. - Now, press
g. Edebug will execute all the code up to that point and pause right at your breakpoint. - Press
uto unset the breakpoint. - Press
qto quit.
5. Practical Exercise: Debugging a Recursive Function
Given your interest in recursion, let's use Edebug to trace a recursive function that builds a table of contents. This is a great way to see the call stack in action.
Here is a function that generates a simple Markdown list for a nested table of contents, represented as a list of lists.
(defun generate-toc (items level)
  "Recursively generate a Markdown list for a table of contents."
  (let ((indent (make-string (* 2 level) ?\s)))
    (mapconcat
     (lambda (item)
       (if (listp item)
           ;; It's a sub-list, recurse.
           (generate-toc item (1+ level))
         ;; It's a string, format it.
         (format "%s* %s" indent item)))
     items
     "\n")))

(defun create-story-outline ()
  "Create an outline for a story."
  (interactive)
  (let ((outline
         '("Prologue"
           ("Chapter 1: The Call" "Chapter 2: The Journey")
           "Interlude"
           ("Chapter 3: The Climax" "Chapter 4: The Aftermath")
           "Epilogue")))
    (message (generate-toc outline 0))))
Your Task:
- Copy both functions into your
*scratch*buffer and evaluate them. - Instrument only the
generate-tocfunction usingC-u C-M-x. We want to see how this specific function behaves. - Run
M-x create-story-outline. This will callgenerate-tocand trigger Edebug. - Step through the first call:
- Press
SPCa few times. Note the value oflevel(it should be 0). - Step until you are about to evaluate the
(mapconcat ...)expression.
- Press
- Observe the recursion:
- Keep stepping. When the
lambdafunction encounters the sub-list("Chapter 1: The Call" "Chapter 2: The Journey"), it will callgenerate-tocagain. - You will now be in a new Edebug session for this recursive call. Notice the execution arrow jumps back to the top of
generate-toc. - Step a bit and observe the value of
levelnow. It should be 1.
- Keep stepping. When the
- Use a breakpoint:
- Quit the current Edebug session with
q. Re-runM-x create-story-outlineto start over. - This time, place your cursor on the line
(generate-toc item (1+ level)). - Set a breakpoint with
b. - Press
g. Execution will stop right before the first recursive call. - Press
gagain. Execution will stop before the second recursive call. This lets you quickly jump between recursive steps.
- Quit the current Edebug session with
- When you're finished exploring, use
qto exit completely and remember to de-instrument the function by re-evaluating it normally.
Conclusion
You have now moved from being a passenger in the debugger to being the driver. Edebug is one of the most powerful tools at your disposal for understanding Elisp. It demystifies complex code by letting you watch it execute at your own pace.
Key Takeaways:
- Edebug is a source-level debugger used for proactive code inspection.
- You must instrument a function before debugging it, typically with
C-u C-M-x. - The
=>arrow shows your current position in the code. SPCis the primary command to step through expressions one by one.- You can set breakpoints with
bto pause at specific locations and usegto run until you hit one. qquits the debugger and aborts the current execution.
Preview of the Next Lesson
With robust tools for both reactive debugging (toggle-debug-on-error) and proactive inspection (Edebug), you are now well-equipped to tackle more ambitious projects. In our next lesson, we will begin the final module by building a practical command from scratch. You will learn to write a command that extracts text from the active region, transforms it, and replaces it, combining your knowledge of functions, buffer manipulation, and now, debugging.