Introduction
Welcome back. In our last lesson, we designed the operating model for your new delivery organization. We defined the team structures using Team Topologies, clarified key roles and responsibilities through the "Team API" concept, and established the formal interaction modes that enable smooth collaboration. We have the blueprint for how teams should work.
Now, we need to answer a critical question: "Is it working?" A transformation's success cannot be judged on feelings or anecdotes alone. As a leader, you need objective data to understand performance, guide improvements, and demonstrate the value of the change.
This lesson directly addresses the learning outcome: Define metrics for delivery process performance including cycle time, deployment frequency, and lead time. We will introduce the industry-standard DORA metrics, a set of four key indicators that provide a comprehensive view of your software delivery performance. Mastering these will give you the vital signs to monitor the health of your engineering organization throughout the transformation.
Part 1: Moving Beyond Flawed Metrics
In your experience with project and product management, you've likely encountered various attempts to measure team productivity. Metrics like lines of code, story points completed per sprint (velocity), or individual developer "utilization" are common. However, these metrics are often ineffective and can be counterproductive.
To understand why, and to see what a better approach looks like, let's start with a video that introduces the DevOps Research and Assessment (DORA) metrics and their scientific foundation.
Measuring Software Delivery With DORA Metrics
This video from Modern Software Engineering explains why traditional metrics fail and introduces the DORA metrics as a more effective alternative for measuring software delivery.
Please watch the video from the beginning until 06:19. Focus on two key points: The critique of traditional metrics like lines of code and velocity. The background of the DORA metrics and why they represent a significant step forward.
As the video highlights, traditional metrics are easily gamed and don't correlate with business outcomes. More lines of code don't mean more value; in fact, it can mean more complexity and maintenance cost. Inflating story point estimates can make a team's "velocity" chart look good while actual delivery slows down.
The DORA metrics, developed from years of rigorous, large-scale research, shift the focus from measuring activity to measuring outcomes. They measure the two things that matter most in a modern software organization: speed and stability.
Part 2: The Four Key DORA Metrics
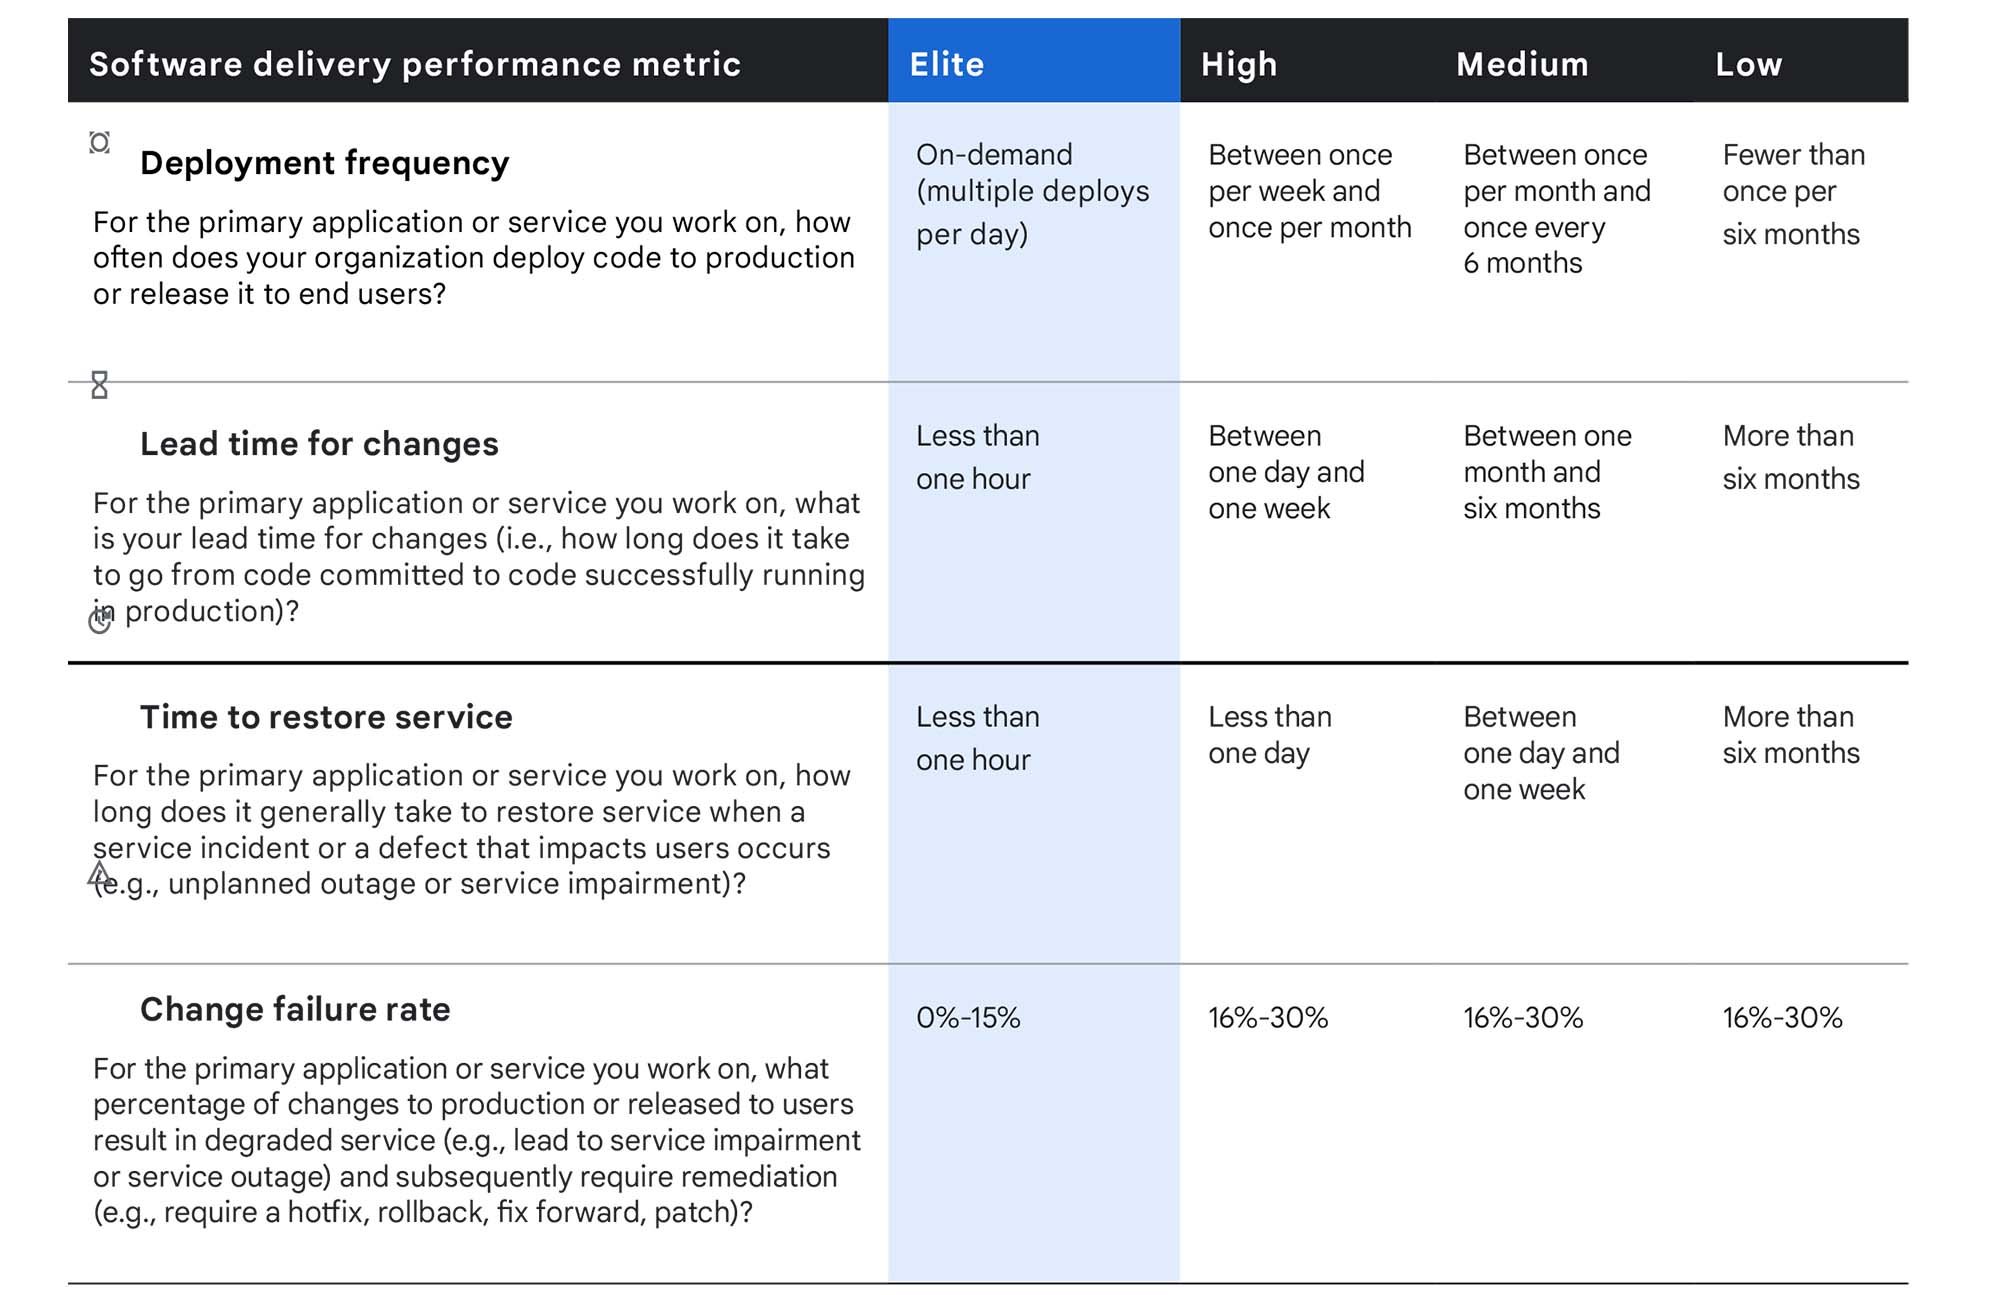
The DORA framework consists of four core metrics, which are best understood as a balanced set. Two measure the throughput (speed) of your delivery process, and two measure the stability (quality) of your product.
Let's get a clear definition of each.
This video from LinearB provides a concise definition of each of the four DORA metrics.
Watch the first two minutes of the video (00:00 - 01:59). Pay close attention to how the four metrics are defined and categorized into 'velocity' and 'quality/stability'.
Now, let's formalize those definitions, drawing from the official DORA guide.
DORA's software delivery performance metrics - DORA.dev
This guide from DORA.dev provides the authoritative definitions of the core software delivery performance metrics. We'll focus on the sections defining throughput and instability.
Please read the introduction and the sections 'Throughput and instability,' 'Throughput,' and 'Instability.' These provide clear, concise definitions for the key metrics.
To summarize and consolidate, the four key metrics are:
Throughput Metrics (Speed):
- Deployment Frequency: How often does your organization successfully deploy code to production? This measures the cadence of your delivery process. Elite teams deploy on-demand, often multiple times per day.
- Lead Time for Changes: How long does it take to get a commit from version control into production? This is a crucial measure of your process efficiency and is often what developers mean when they talk about "cycle time."
Stability Metrics (Quality):
- Change Failure Rate: What percentage of deployments to production result in a degraded service and require remediation (e.g., a hotfix or a rollback)? This measures the quality and reliability of your deployment process.
- Time to Restore Service (also called Mean Time to Recovery or MTTR): How long does it take to restore service when a service incident or a defect that impacts users occurs? This measures the resilience of your system and your team's ability to respond to failure.
Clarifying "Lead Time" vs. "Cycle Time"
The terms "lead time" and "cycle time" can be a major source of confusion, as they are used differently in different contexts (e.g., manufacturing, project management, software development).
- Lead Time (Traditional): In a project management context, this often means the entire duration from when an idea is first proposed or a requirement is logged (e.g., a Jira ticket is created) to when it is delivered to the customer.
- Cycle Time: This typically measures the time from when work actively begins on a task to when it is completed.
- Lead Time for Changes (DORA): This is a very specific metric measuring the time from commit to deploy. It is a subset of the overall process, focusing purely on the technical delivery pipeline.
The following image provides an excellent visual clarification.

For your role, it's crucial to be precise. When discussing performance with engineers, "Lead Time for Changes" is the key technical metric. When talking with product managers or business stakeholders, you may need to discuss the broader "idea-to-delivery" Lead Time, but be clear about the distinction.
Lead Time vs. Cycle Time in Software Development - Waydev
To solidify your understanding, this article explicitly breaks down the differences between Lead Time and Cycle Time in software development.
Read the section 'What are The Main Differences Between Lead Time and Cycle Time?' Pay special attention to the summary table which provides a clear side-by-side comparison.
Part 3: The Myth of the Speed vs. Stability Trade-off
A common misconception in management is that you must trade speed for stability. The thinking goes: "If we want to go faster, we have to accept more bugs. If we want higher quality, we have to slow down."
The DORA research has proven this to be a false dichotomy. Elite performers are fast and stable. They deploy frequently with very low failure rates.
How is this possible? By building quality into the process through automation, working in small batches, and having robust, fast feedback loops. A team that can deploy small changes quickly can also identify and fix issues much faster, leading to a higher MTTR.
This next segment explains why treating speed and stability as a trade-off is a dangerous anti-pattern.
Measuring Software Delivery With DORA Metrics
Let's return to the 'Measuring Software Delivery' video to understand the critical relationship between the throughput and stability metrics.
Please watch from 09:33 to 11:42. The key takeaway is understanding why optimizing for throughput alone will ultimately make you slower.
As a leader, your goal is not to push one metric at the expense of others. Your goal is to foster an environment where teams can improve across all four metrics simultaneously. This creates a sustainable pace and avoids the burnout that comes from constantly cutting corners to meet artificial speed targets.
Part 4: Practical Application and Avoiding Pitfalls
Defining metrics is the easy part. Using them effectively—and not using them to create perverse incentives—is the challenge. As the transformation leader, your role is to ensure these metrics are used as tools for learning and improvement, not as weapons for blame or competition.
The official DORA guide has an excellent list of common pitfalls to avoid.
DORA's software delivery performance metrics - DORA.dev
This section of the DORA.dev guide is perhaps the most important for you as a leader. It outlines how to implement these metrics without causing unintended negative consequences.
Read the 'Common pitfalls' section carefully. These are the traps you must help your organization avoid.
Key pitfalls to internalize:
- Never set the metric as the goal. (Goodhart's Law: "When a measure becomes a target, it ceases to be a good measure.") If you tell a team their goal is to increase deployment frequency, they might start deploying trivial, valueless changes just to hit the number.
- Don't create competitions. Using leaderboards fosters gaming and can demoralize teams whose context makes high scores difficult (e.g., a legacy system team vs. a new microservice team). The goal is for each team to improve against its own baseline.
- Use the metrics as a balanced set. Don't focus on just one. An improvement in Lead Time for Changes is only a true improvement if the Change Failure Rate doesn't get worse.
- Apply metrics at the team/service level, not the individual level. These are systems-level metrics.
Practical Application Exercise
Imagine you are preparing to introduce DORA metrics at your company. You are in a meeting with your Head of Engineering and your Head of Product.
-
Explaining the Concepts (5 mins): The Head of Product says, "Our lead time is already terrible. It takes us six months to get an idea into the hands of a customer. How does this 'Lead Time for Changes' metric help me?" How would you answer, clarifying the distinction and explaining why improving the technical metric is a prerequisite for improving the business one?
-
Addressing a Bad Suggestion (5 mins): The Head of Engineering, excited by the metrics, says, "This is great! I'll create a dashboard for all teams. We'll give a quarterly bonus to the team with the highest Deployment Frequency and the lowest Lead Time for Changes. That will get everyone motivated!" Based on the pitfalls we've discussed, identify at least two major risks with this approach and explain how you would gently guide them toward a more constructive use of the metrics.
Take a few moments to structure your thoughts before reviewing the suggested approach below.
Suggested Approach
-
Explaining the Concepts: "That's an excellent point, and you're right to focus on the full 'idea-to-customer' lead time. That's ultimately what the business cares about. The 'Lead Time for Changes' we're discussing here is a specific, technical subset of that larger lead time. It measures from the moment a developer commits code to the moment it's live. Think of it as the 'last mile' of our delivery process. If that last mile is slow and unpredictable—taking weeks or months—it's impossible for us to ever have a fast overall business lead time. By focusing on and improving this technical part of the process, we create the capability to release value much more quickly. Once our delivery pipeline is fast and reliable, we can then work on optimizing the 'first mile'—the process of refining ideas and getting them ready for development."
-
Addressing a Bad Suggestion: "I love the enthusiasm, and I agree that visibility is key. However, I'm concerned that turning this into a competition with a bonus could have some unintended consequences.
- Risk 1 (Gaming the metrics): If we only reward Deployment Frequency, teams might be incentivized to push out many small, low-value changes just to increase their count, without actually delivering more customer value. They might also cut corners on testing to reduce Lead Time, which could increase our Change Failure Rate.
- Risk 2 (Unfair Comparisons): We'd be comparing teams with very different contexts. The team working on our new microservices platform will naturally have an easier time improving these metrics than the team maintaining our 10-year-old monolith. A competition would be demoralizing for them and wouldn't reflect their effort.
- A Better Approach: Instead of a competition, let's use the dashboard to help each team establish its own baseline. The goal isn't for Team A to beat Team B, but for Team A to improve its own performance over time. We can use these metrics as a starting point for conversations in retrospectives: 'Our Lead Time for Changes went up this month. Why? What were the bottlenecks?' This fosters a culture of continuous improvement, not one of winners and losers."
Conclusion
In this lesson, you have learned to define and differentiate the key metrics for measuring software delivery performance. These metrics provide a balanced view of both the speed and stability of your engineering organization.
Key Takeaways:
- Modern delivery performance is best measured by DORA metrics, not traditional metrics like lines of code or story points.
- The four key metrics are Deployment Frequency, Lead Time for Changes, Change Failure Rate, and Time to Restore Service.
- Speed and stability are not a trade-off. Elite-performing organizations excel at both simultaneously.
- Metrics should be used as tools for continuous improvement, not as targets for competition or blame. Be mindful of the common pitfalls.
Preview of the Next Lesson
Now that you have the tools to measure performance, the next logical step is to apply them. In our upcoming lesson, we will focus on the learning outcome: "Assess current delivery process maturity and identify transformation gaps." We will discuss how to use the DORA metrics, along with qualitative methods like value stream mapping, to create a baseline of your current state. This assessment will be the foundation for prioritizing your transformation efforts and demonstrating progress over time.