Introduction
Welcome back! In our previous lesson, we compared several large-scale Agile frameworks like SAFe, LeSS, and the Spotify model. This gave you a menu of potential "future states" for your organization's delivery process. However, as any good strategist knows, you can't plot a course to your destination without first knowing your starting point.
This lesson directly addresses that need. Our learning outcome is to assess current delivery process maturity and identify transformation gaps. You'll learn how to move from subjective feelings about what's working and what isn't to a concrete, evidence-based diagnosis of your delivery system's health. We will explore both qualitative and quantitative methods that will form the diagnostic backbone of your transformation program. These tools will allow you to build a compelling, data-driven case for change and create a targeted roadmap for improvement.
Part 1: Visualizing the Process to Find Waste
Before you can improve a process, you must see it. One of the most effective ways to understand a delivery process is to map it from start to finish. This helps uncover a crucial source of inefficiency: waste (or Muda, in Lean terminology), which is any activity that consumes resources but doesn't add value for the customer. In software, the most common form of waste is waiting.
Value Stream Mapping (VSM) is a powerful Lean technique for visualizing, analyzing, and improving the flow of work. It helps you distinguish between value-adding work time and non-value-adding wait time, exposing the bottlenecks and delays that are often invisible in day-to-day operations.
Value Stream Mapping Quickstart Guide | A Simple Approach | For Any Industry
This video, 'Value Stream Mapping Quickstart Guide', provides a fantastic, non-manufacturing-focused introduction to VSM. It explains the core concepts and walks through a simplified example that is highly relevant to a software or service environment.
Please watch from the beginning to 12:10. Focus on: What VSM is and why it's important for seeing the whole system (00:34 - 02:43). How to create a simple VSM by identifying steps and quantifying 'work time' vs. 'calendar time' (04:00 - 07:43). Tips for success, especially getting the right people involved and using real data (07:43 - 09:42). How to analyze the map to find improvement opportunities using techniques like the '5 Whys' (09:42 - 12:10).
As the video demonstrates, a VSM session is a powerful collaborative exercise. By bringing together people from different stages of the delivery process, you create a shared understanding of the current reality. The key output is a clear visualization of your process efficiency, which is the ratio of value-adding time to the total lead time.
Process Efficiency = (Value-Adding Time) / (Total Lead Time)
In many organizations, this number is surprisingly low—often below 10%. Calculating this metric for your own process provides a powerful, quantitative starting point for your transformation narrative. A VSM workshop will immediately highlight the biggest "gaps" in your process in the form of long wait times between steps.
Part 2: Measuring Performance with DORA Metrics
While VSM is excellent for understanding process flow and identifying waste, we also need objective, outcome-oriented metrics to measure the overall performance of the delivery system. The most respected and widely adopted framework for this is the DORA metrics.
Developed by the DevOps Research and Assessment (DORA) team at Google, these four metrics provide a balanced view of software delivery performance, covering both speed (throughput) and stability.
This short video, 'DORA Metrics Explained', gives a quick and clear overview of the four key metrics and why they matter.
Please watch the entire video (00:00 - 07:48). As you watch, note down the definition of each of the four metrics and the key insight or common mistake associated with each one.
To place these metrics in the broader context of a maturity assessment, let's turn to a brief reading.
DevOps Maturity Models explained: a guide for modern enterprises
The article 'DevOps Maturity Models explained' discusses how frameworks like DORA are used to formally assess an organization's maturity level.
Please read the sections 'There’s no one standard: different models, different strengths' and 'How can organisations determine their current DevOps maturity level?'. This will reinforce your understanding of the DORA metrics and show how they are used for benchmarking.
Let's summarize the four DORA metrics you've just learned about:
Throughput Metrics (Speed)
- Deployment Frequency: How often does your organization successfully release to production? (Measures agility)
- Lead Time for Changes: How long does it take to get a change from code committed to successfully running in production? (Measures delivery speed)
Stability Metrics (Quality)
3. Change Failure Rate: What percentage of deployments to production result in a failure (e.g., require a hotfix, rollback, or cause an outage)? (Measures release reliability)
4. Mean Time to Recovery (MTTR): How long does it take to restore service after a production failure? (Measures resilience)
Measuring these four metrics provides an objective baseline of your current delivery capability. For example, you might find that your Lead Time for Changes is 60 days, while elite performers measure it in hours. This delta is a powerful transformation gap to highlight.
Part 3: A Holistic View of Maturity
High-performing delivery is about more than just flow and metrics. It's also about the underlying principles, values, and culture. A truly mature organization doesn't just do Agile; it is Agile.
The "Agile Onion" is a useful model for visualizing these layers of maturity.

To assess these deeper layers, you can move beyond quantitative metrics and evaluate your organization against a set of core principles.
Core principles of software delivery maturity
The article 'Core principles of software delivery maturity' from Luxoft provides a checklist of qualitative principles that indicate a mature delivery organization. This complements the quantitative focus of DORA.
Please read the sections on three key principles: '1. Effective stakeholder management', '3. Effective governance', and '6. Embedded quality'. As you read, think about how you would qualitatively assess your organization's performance against these principles. For example, for 'Embedded quality', you could ask: 'Is quality seen as everyone's job, or is it the sole responsibility of a separate QA team?'
By combining a process view (VSM), performance metrics (DORA), and a principles-based assessment, you create a comprehensive, 360-degree picture of your current delivery maturity. This allows you to identify not just what the gaps are (e.g., long lead times) but also why they exist (e.g., siloed teams, lack of embedded quality, ineffective governance).
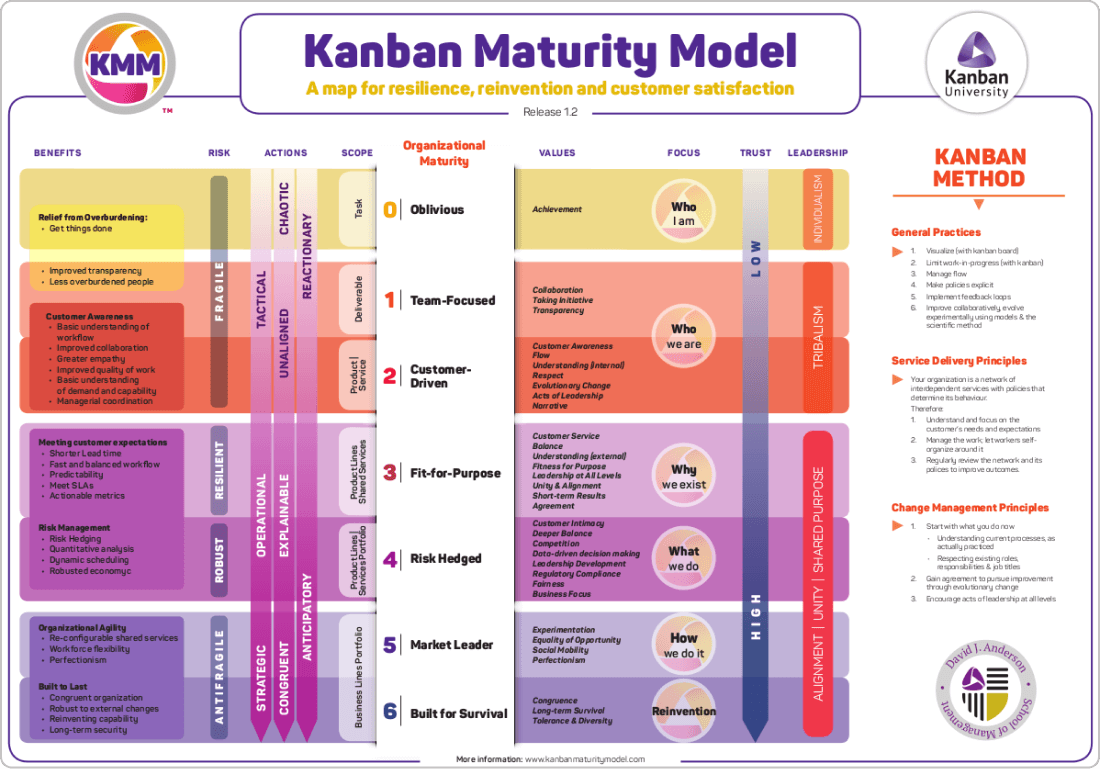
More advanced frameworks like the Kanban Maturity Model (KMM) provide a highly structured path through different levels of organizational maturity, but the core idea remains the same: know where you are before you plan your journey.
Practical Application
Let's synthesize what you've learned.
Exercise (Approx. 10 minutes):
Imagine you are kicking off the Delivery Process Transformation workstream. Your first task is to present an assessment plan to the Head of Engineering.
Based on the tools and concepts from this lesson, outline your plan. Your outline should answer the following questions:
- What are the key questions you want to answer about the current process? (e.g., How fast can we deliver value? How reliable are our releases?)
- What specific methods and tools will you use to get the answers? (Be specific about VSM, DORA, etc.)
- What data, both qualitative and quantitative, will you need to collect?
- Who needs to be involved in this assessment process?
Write a few bullet points for each question to structure your plan. This will serve as a powerful artifact you can adapt for your real-world transformation program.
Conclusion
In this lesson, you've moved from discussing potential future states to diagnosing the present reality. You now have a toolkit for conducting a robust assessment of your organization's delivery process maturity.
Key Takeaways:
- A comprehensive assessment combines qualitative and quantitative data. You need both the "story" and the "numbers."
- Value Stream Mapping (VSM) is a powerful tool for visualizing your process, calculating efficiency, and identifying sources of waste and delay (gaps).
- DORA metrics provide an industry-standard, outcome-focused way to benchmark your delivery throughput and stability against high-performing teams.
- True maturity is a cultural and mindset issue. Frameworks like the Agile Onion remind us to assess the deeper principles and values, not just the visible tools and processes.
Preview of the Next Lesson
Assessing your current state and identifying gaps is the critical first step. The logical next question is: "How do we organize our teams to close these gaps?" Your VSM will likely reveal delays caused by handoffs between functional teams (UI, API, DB). Your DORA metrics might show a long lead time for changes due to these same dependencies.
In our next lesson, we will directly address this by exploring the learning outcome: "Define team topologies suitable for a microservices architecture such as stream-aligned and platform teams." You'll learn how to design an organizational structure that minimizes handoffs and empowers teams to deliver value quickly and autonomously, directly addressing the core problems your assessment will uncover.