Hello! Welcome to your fourth lesson in the Foundations of Business Analysis module.
In our last session, you learned how to take a vague business complaint and structure it into a clear, measurable problem statement. That skill is essential for aligning stakeholders and defining a project's purpose. But defining a problem is only half the story. Solving the problem you've defined, only for it to reappear a few months later, is a common frustration and a sign that you've only treated a symptom.
Today, we move from "what" the problem is to "why" the problem is happening. Your goal for this lesson is to learn how to perform root cause analysis using techniques like 5 Whys and Fishbone diagrams. This is the detective work of business analysis, allowing you to identify the underlying issues that, once fixed, prevent problems from recurring. This capability is highly valued and frequently tested in BA interviews.
Beyond Firefighting: The Goal of Root Cause Analysis
In many fast-paced operational or project management roles, the focus is often on "firefighting"—quickly implementing a fix to keep things moving. While necessary in the short term, this approach often leads to dealing with the same issues over and over again. Root cause analysis (RCA) is the more strategic approach. It takes extra time upfront to investigate the origins of a problem to ensure that the eventual solution is permanent.
To understand this distinction and the different levels of solutions, let's watch a short video.
Root Cause Analysis Course - 5 Whys and Fishbone Diagram
This video from Brion Hurley's course on Root Cause Analysis effectively contrasts the typical 'firefighting' approach with a more sustainable problem-solving process. It also introduces the types of corrective actions a BA might recommend.
Please watch the following two segments: From 03:05 to 04:17 to understand the difference between firefighting and the preferred RCA approach. From 05:44 to 08:06 to learn about the three types of corrective actions: Immediate, Permanent, and Preventive. This framework is key for recommending robust solutions.
As you can see, a Business Analyst's objective isn't just to find any solution. It's to find a solution that leads to a permanent or preventive action. This is how you create lasting business value.
Technique 1: The 5 Whys
The 5 Whys is a simple yet powerful technique for drilling down into a single chain of cause and effect. It's a straightforward, linear method that helps you move past surface-level explanations to find a process or system-level failure.
The article '5 Whys vs Fishbone Diagram' from AIGPE provides a clear explanation of how to apply the 5 Whys technique effectively.
Read the section 'The 5 Whys: A Simple, Straightforward Approach' up to 'The Fishbone Diagram'. Pay close attention to the ground rules, especially the principle of focusing on process, not people. This is a critical mindset for a BA.
The 5 Whys in Action
The key is to keep asking "Why?" until you arrive at a fundamental cause that, if addressed, would prevent the entire chain of events from reoccurring. Let's watch a classic, memorable example.
Root Cause Analysis Course - 5 Whys and Fishbone Diagram
This clip uses the real-world problem of the deteriorating Washington Monument to show how the 5 Whys technique can uncover a surprising and non-obvious root cause.
Watch the segment from 00:14:16 to 00:16:06.
Applying the 5 Whys to an AdTech Scenario
Let's ground this in your AdTech background.
Problem Statement: The monthly client advertising report was sent 48 hours late, violating our Service Level Agreement (SLA).
- Why was the report late?
- Because the data from the primary advertising platform was not available on time.
- Why was the data not available?
- Because the automated data export script failed to run overnight.
- Why did the script fail?
- The script's access token had expired, so it couldn't authenticate with the platform's API.
- Why had the token expired?
- The new security policy requires tokens to be refreshed every 30 days, but no one was assigned to do it for this script.
- Why was no one assigned to do it?
- The script was built by a developer who has since left the company, and its ownership was never formally transferred during the offboarding process.
Root Cause: A process failure. The company lacks a formal process for transferring ownership of automated tools and scripts during employee offboarding.
Notice the final "why" identifies a process issue, not a person to blame. The solution isn't to scold someone; it's to fix the offboarding process.
Technique 2: The Fishbone (Ishikawa) Diagram
While the 5 Whys technique is great for single-cause problems, many business issues are more complex, with multiple contributing factors. The Fishbone Diagram (also called a Cause-and-Effect or Ishikawa Diagram) is a visual brainstorming tool used to explore and categorize a wide range of potential causes.
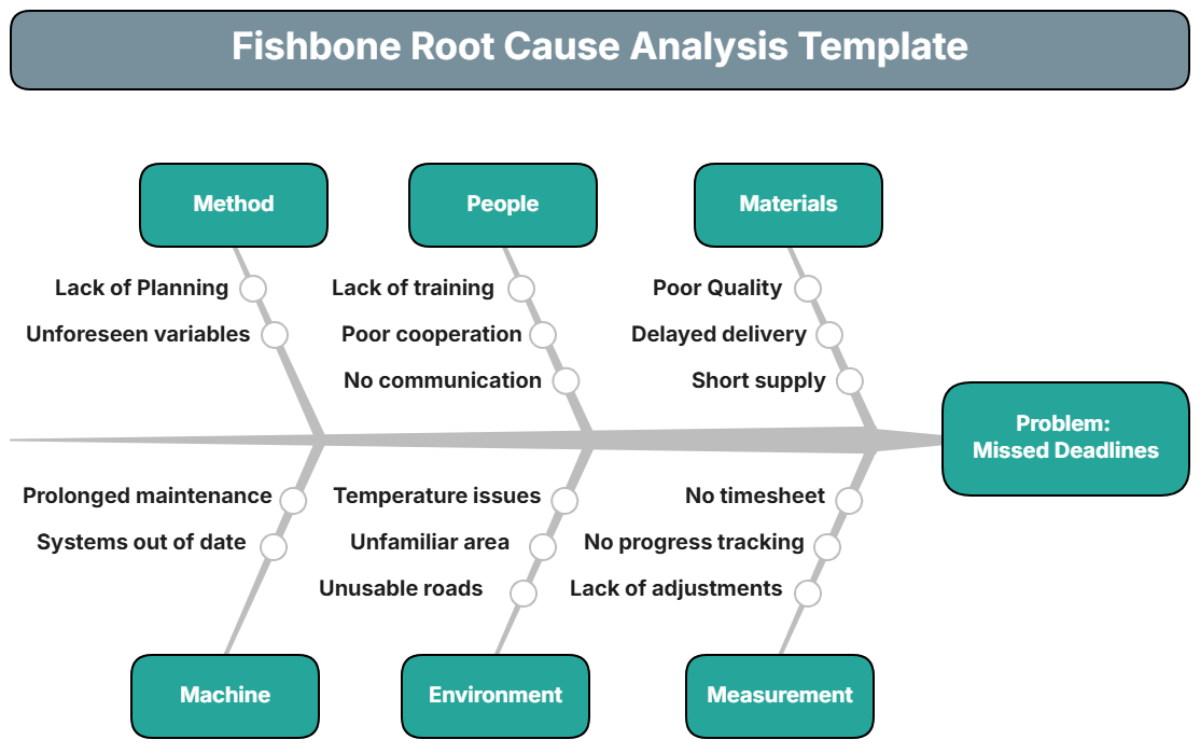
To get a comprehensive understanding of how to build and use one, we'll turn to a detailed video guide.
Fishbone Diagram EXPLAINED - Root Cause Analysis Techniques
The Business Analysis Doctor provides an excellent, in-depth explanation of the Fishbone Diagram, including its components, creation process, and how it fits into a larger analysis.
Please watch the following two segments: From 01:15 to 05:00, which details the main components, including different sets of cause categories (like the 8Ms, 8Ps, and 4Ss). From 08:46 to 11:45, which provides a step-by-step guide on how to facilitate a Fishbone analysis session, from brainstorming to prioritizing causes.
Tailoring Categories for Your Domain
As the video mentioned, the categories (the "bones" of the fish) are flexible. While "Man, Machine, Method" are common in manufacturing, you can adapt them to your context. For your work in AdTech and marketing, a highly effective set of categories comes from an article on RCA in performance marketing.
How to Do Root Cause Analysis in Performance Marketing
This article, 'How to Do Root Cause Analysis in Performance Marketing', proposes a powerful, domain-specific adaptation of the Fishbone categories.
Read the first two sections, 'Root Cause Analysis 101' and the brief intro to the four levers. Focus on how the Fishbone Diagram is presented and how the author simplifies the categories into four practical 'levers' for marketing analysis: Audience, Creative, Bids, and Budget.
Using these four levers makes the analysis immediately relevant. If the problem is "Customer Acquisition Cost (CPA) increased by 30%," you can structure your team's brainstorming like this:
- Audience: Did our targeting change? Did a competitor start targeting our audience more aggressively?
- Creative: Are our ads suffering from creative fatigue? Did we launch new ads that are underperforming?
- Bids: Did platform auction prices increase? Did we change our bidding strategy?
- Budget: Did we shift the budget away from high-performing campaigns?
Test your understanding!
Problem: The click-through rate (CTR) for our main ad campaign on Facebook dropped by 50% this week.
Using the Audience, Creative, Bids, Budget categories, list at least one potential cause for each category.
Show answer
Here are some possible answers:
- Audience: Facebook's algorithm might have started showing the ad to a less relevant audience segment, or we might have accidentally broadened the targeting parameters to include less interested users.
- Creative: The ad creative has been running for too long and users are now ignoring it (creative fatigue).
- Bids: We may have lowered our bid, causing Facebook to show the ad in less prominent placements, leading to fewer clicks.
- Budget: A lower daily budget might be causing the ad to stop serving before it reaches the most engaged users who are typically active later in the day.
Choosing Your Tool: 5 Whys vs. Fishbone
So, when do you use each tool? It's about matching the tool to the complexity of the problem.
| Criteria | 5 Whys | Fishbone Diagram |
|---|---|---|
| Approach | Linear and deep | Visual and broad |
| Complexity | Best for simple problems with a likely single cause | Ideal for complex problems with multiple potential causes |
| Use Case | Drilling down into a specific, known symptom | Brainstorming and exploring all possibilities |
| Collaboration | Can be done solo or in a small group | Best used in a collaborative, cross-functional workshop |
Often, the most effective approach is to use them together. This is a common practice for professional BAs.
- Start with the Fishbone Diagram: Use it in a workshop with stakeholders to brainstorm all possible causes for a complex problem. This gives you a comprehensive map of the problem space.
- Prioritize and Drill Down with 5 Whys: Once the diagram is complete, have the team vote on the 1-3 most likely causes. Then, use the 5 Whys technique on each of those high-priority causes to find their respective root causes.
This hybrid method combines the breadth of the Fishbone with the depth of the 5 Whys, giving you a structured and thorough analysis.
Conclusion
You now have two essential techniques for moving beyond symptoms to discover the true source of business problems. Mastering root cause analysis will make your solutions more effective and is a key differentiator for a high-performing Business Analyst.
Key Takeaways:
- Think Like a Detective: Your goal is to find the underlying cause, not just patch the immediate symptom. Aim for permanent and preventive solutions.
- Use 5 Whys for Depth: When you suspect a single cause or need to drill down into a specific issue, the 5 Whys provides a simple, linear path to the root.
- Use Fishbone for Breadth: For complex problems with many potential factors, the Fishbone Diagram is an excellent collaborative tool for brainstorming and categorizing possibilities.
- Combine for Power: Use the Fishbone diagram to explore the landscape of potential issues, then use 5 Whys to dig deep into the most likely culprits.
Preview of the Next Lesson:
We've now defined our problem and diagnosed its root causes. This gives us a very clear picture of the current state. The next logical step is to define where we want to be—the desired state. In the next lesson, we will learn how to conduct gap analysis to compare current and desired business states, bridging the gap between problem and solution.