Hello! Welcome to your second lesson.
In our previous session, we created a map of a C program's memory, identifying the text, data, BSS, heap, and stack segments. We established that the stack is where local variables live, managed automatically by the compiler.
Today, we will zoom in on that crucial segment. Our goal is to explain the function call stack mechanism, including stack frames, local variables, and return addresses. This is a fundamental concept in C, and a solid grasp of it is often tested in interviews to gauge your understanding of program execution, memory, and potential bugs like stack overflows.
1. The Call Stack: An Overview
At a high level, the call stack is a region of memory that a program uses to keep track of its active function calls. It operates on a Last-In, First-Out (LIFO) principle. When a function is called, a new block of memory is "pushed" onto the stack; when the function returns, that block is "popped" off.
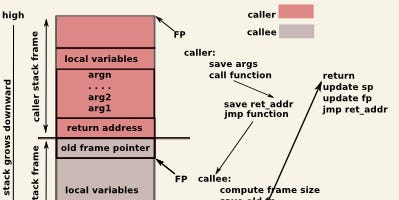
This block of memory is known as a stack frame (or activation record). Each function call gets its own unique stack frame.
A stack frame typically holds three key pieces of information:
- Local Variables: Variables declared inside the function.
- Function Arguments: The parameters passed to the function.
- Return Address: The location in the code where execution should resume after the function completes.
To start, let's watch a short video that provides an excellent high-level introduction to the call stack and stack frames.
The Call Stack and Stack Overflows (example in C)
The video 'The Call Stack and Stack Overflows' by Jacob Sorber clearly explains what the call stack is, where it resides in memory, and what a stack frame contains.
Please watch from 00:47 to 02:30. Focus on the concepts of the stack's location and growth direction, the purpose of a stack frame, and its main contents.
The diagram below provides a clean, abstract model of how two stack frames—one for the calling function (the "caller") and one for the function being called (the "callee")—are organized.
2. The Mechanics of a Function Call
Now, let's dive into the "how." The creation and destruction of stack frames are orchestrated by a sequence of low-level assembly instructions. This process is standardized by a calling convention, which is a set of rules that ensures functions written and compiled separately can interoperate correctly.
The process involves two main phases:
- Function Prologue: A standard set of instructions at the start of a function that sets up its stack frame.
- Function Epilogue: A standard set of instructions at the end of a function that tears down its stack frame and returns control to the caller.
To manage this, the CPU uses a few special-purpose registers:
- Stack Pointer (SP or
espon x86): Always points to the top of the stack. It moves as data is pushed or popped. - Base Pointer (BP or
ebpon x86), also called Frame Pointer (FP): Points to a fixed location within the current function's stack frame. This provides a stable reference point to access local variables and arguments, even as the SP moves. - Instruction Pointer (IP or
eipon x86,ripon x86-64): Points to the next instruction to be executed.
The following video provides a fantastic, step-by-step walkthrough of the assembly instructions involved in a function's prologue and epilogue.
In 'wtf is “the stack” ?', the presenter from Low Level walks through the assembly code to show exactly how a stack frame is built and dismantled.
Watch the following segments: (01:11 - 02:57) This introduces the key registers (ESP, EBP) and the concept of the stack growing towards lower memory addresses. (03:57 - 06:02) This is the core of the demonstration, showing the function prologue: saving the old base pointer, establishing the new one, and allocating space for local variables. (06:02 - 07:41) This explains the function epilogue: cleaning up, restoring the caller's base pointer, and preparing to return. \nFocus on the sequence: push ebp, mov ebp, esp, sub esp, ... for the prologue, and leave (or mov esp, ebp; pop ebp) and ret for the epilogue.
3. A Step-by-Step Walkthrough
To reinforce what you just saw, let's trace a function call using a simple C example. The reading below breaks down the entire journey from main() calling a function add() to add() returning the result.
A Deep Dive into Stack Frames, RIP, SFP, and Return Values
This article provides a clear, textual walkthrough of the function call process, complementing the video you just watched.
Please read the sections 'The Journey: Step by Step' and 'The Three Critical Pieces'. Pay close attention to: How arguments are pushed onto the stack before the call. What the call instruction does (pushing the return address). How the new frame is established by saving the old frame pointer. How arguments and local variables are accessed relative to ebp. How the return value is passed back (via the EAX register), not the stack.
As the article highlights, there are three critical pieces of information managed by the stack mechanism to ensure a function can return correctly:
- Return Instruction Pointer (RIP/EIP): WHERE to return. The address of the next instruction in the caller's code. This is saved on the stack by the
callinstruction itself. - Saved Frame Pointer (SFP): HOW to restore the caller's context. The caller's
ebpvalue is saved on the stack so it can be restored, allowing the caller to access its own local variables again. - Return Value (usually in
eax): WHAT is the result. For simple types like integers and pointers, the return value is efficiently passed back to the caller through a register, avoiding slower stack memory access.
4. Observing the Call Stack in Practice
Your experience with debuggers like Trace32 gives you a practical advantage here. A debugger's "call stack" view is a direct window into this mechanism. It reads the chain of saved frame pointers to show you the sequence of function calls that led to the current point of execution.
The image below, taken from the Keil uVision debugger for an embedded system, shows this in action.

Understanding this mechanism is critical in embedded development for several reasons you are likely familiar with:
- Debugging: Tracing a
bt(backtrace) in a debugger is essential for finding the root cause of a fault. - Memory Management: In resource-constrained systems, you must ensure the stack does not grow too large and collide with other memory segments (a stack overflow), which causes a crash. The size of local variables and the depth of function recursion directly impact stack usage.
- Interrupt Handling: Interrupt Service Routines (ISRs) also use the stack to save the processor's context. An incorrect understanding of stack usage can lead to system instability.
Conclusion
In this lesson, we dissected the function call stack, the engine that drives program flow in C.
Key Takeaways:
- The call stack manages active functions in a LIFO manner.
- Each function call gets a stack frame containing its local variables, arguments, and a return address.
- The function prologue builds this frame using registers like the Stack Pointer (
esp) and Base Pointer (ebp). The epilogue tears it down. - The Base Pointer (
ebp) provides a stable reference for accessing variables within a frame. - The return address tells the CPU where to resume execution, and the return value is typically passed back via a register like
eax.
In our next lesson, we will discuss storage classes (auto, static, extern, register). We'll see how the auto storage class, which is the default for local variables, is directly tied to the stack behavior we've explored today, and how it contrasts sharply with the static keyword.