Hello! Welcome to your next lesson in the "Hands-On with Dental AI Software" module.
In our last lesson, we surveyed the landscape of commercial AI software, identifying the key players like Pearl and Overjet and understanding their primary functions. We saw that the most common application is real-time radiographic analysis.
Today, we're moving from that high-level overview to a "test drive." Our goal is to execute a radiograph analysis using a simulated AI software interface. Instead of just knowing what these tools do, you will learn how a clinician uses them, step-by-step. By the end of this lesson, you will be familiar with the typical workflow and the essential controls for interacting with an AI's diagnostic suggestions.
1. The Standard AI Analysis Workflow
Before we dive into the buttons and sliders of a specific program, let's establish the general sequence of events when using an AI for radiograph analysis. This process is designed to be seamless and integrate directly into your existing clinical workflow.
A blog post from Pearl, one of the leading AI companies we discussed, outlines this process well.
Why you should customize dental treatment plans using ...
This article, 'Why you should customize dental treatment plans using ...', breaks down the AI-assisted workflow into six clear steps. It provides a great mental map for how you get from taking an X-ray to discussing a treatment plan with a patient.
Please read the section titled 'How AI dental treatment planning works.' Focus on the sequence of the six steps described, from image capture to finalizing the plan.
As you read, you'll see the process generally follows these key stages:
- Image Acquisition: You take radiographs as usual. The AI software, running in the background, automatically detects and ingests these new images.
- AI Analysis: The image is securely sent to a cloud-based AI model, which analyzes it and identifies potential findings.
- Results Display: Within seconds, the analyzed image is returned to your screen, now with visual overlays (like boxes or highlights) marking the AI's detections.
- Clinical Review: This is your part. You review the AI's findings, using the software's tools to explore them, and combine this information with your own clinical judgment and patient examination.
Today, we'll simulate steps 3 and 4 using the interface of a real, FDA-cleared product: Pearl's Second Opinion®.
2. A Guided Simulation: Using the AI Interface
We will now walk through the process of analyzing a radiograph as if you were using the Second Opinion® software. We'll use its official user manual to guide our simulation.
Step 1: Locating and Opening the Radiograph
First, a clinician needs to find the right patient and the right image. AI software is designed to integrate with your existing patient records.
[PDF] Second Opinion Client User Manual 1.4.docx
The 'Second Opinion Client User Manual' details the initial steps of using the software. This section explains how the system is organized and how you navigate to a specific patient's images.
Please read the following sections to understand the navigation process: Start with the overview in section 5.1, 'How Second Opinion® Operates.' Then, review sections 5.2.5 ('Navigating Patient Records'), 5.2.6 ('Finding Specific Charts'), and 5.2.7 ('Typical Image Display'). Focus on how patient images are organized into 'Charts' by date and how selecting a chart brings up the main 'Detection screen'.
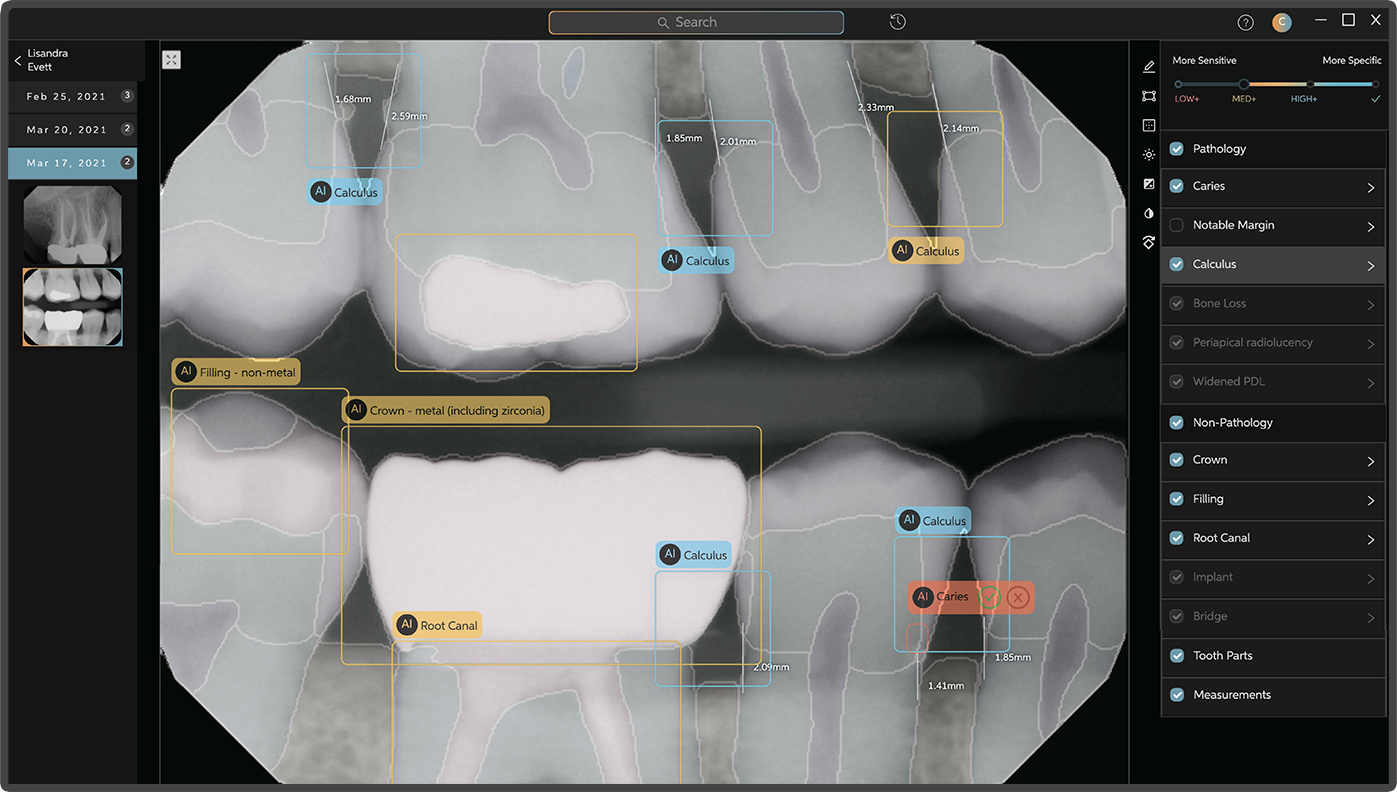
After launching the application and selecting a patient chart, you are presented with the main analysis screen. It typically has three key areas, as shown in the image below:
- Image Selector Pane (Left): A filmstrip of all radiographs in the patient's chart, allowing you to switch between different images.
- Radiograph Display Pane (Center): The main view showing the selected radiograph with AI overlays.
- Conditions Index (Right): A list of all potential conditions (pathologic and non-pathologic) detected by the AI in the current image.
Step 2: Interpreting the Initial Detections
Once an image is displayed, the AI has already done its work. Your screen is now populated with visual aids designed to draw your attention to specific areas. The most important of these are the bounding boxes and their associated confidence levels.
Let's learn how to read these results.
[PDF] Second Opinion Client User Manual 1.4.docx
This is the most critical part of the user manual for a new user. It explains what the different colored boxes mean and how they relate to the AI's confidence in a detection.
Please read section 5.2.9, 'How to Read Results.' Pay close attention to the meaning of the three color codes: Aqua Blue, Yellow, and Red.
To summarize the key point from the manual: the colors of the bounding boxes indicate the AI's confidence, which is directly tied to the trade-off between sensitivity and specificity we will discuss later in the course.
- Aqua Blue (High Confidence): The AI is very sure. These detections were made using a high-specificity approach, meaning it's less likely to be a false positive.
- Yellow (Medium Confidence): The AI is moderately sure. This represents a balance between sensitivity and specificity.
- Red (Low Confidence): The AI has low confidence. These detections were made using a high-sensitivity approach, meaning the AI is flagging anything that could possibly be a finding, at the risk of including more false positives. You should review these with extra scrutiny.

Step 3: Actively Analyzing with Interface Controls
"Executing an analysis" is an active process. You don't just accept the initial display; you interact with it to build a complete picture. The most powerful tool for this is the Confidence Slider.
Let's see how it works.
[PDF] Second Opinion Client User Manual 1.4.docx
The Confidence Slider is a primary interactive tool. This section of the manual explains how to use it to filter the AI's findings based on your desired level of certainty.
Please read section 5.2.10, 'How to Use the Confidence Slider.' Understand what happens when you move the slider to the 'High,' 'Med,' and 'Low' positions.
By moving the slider, you can dynamically change the trade-off between sensitivity and specificity for the findings displayed on the screen:
- Slider at "Low" (Most Sensitive): You see everything—Red, Yellow, and Aqua detections. This is useful for an initial broad sweep to ensure nothing is missed.
- Slider at "Med": You see only Medium and High confidence detections (Yellow and Aqua), filtering out the most speculative findings.
- Slider at "High" (Most Specific): You see only the High confidence detections (Aqua). This is useful for confirming the most certain findings.
The recommended workflow is to cycle through all three settings to gain a full understanding of what the AI has found.
Step 4: Refining the View and Examining the Image
Finally, the software provides additional tools to help you focus on what's relevant and to get the best possible view of the radiograph itself.
[PDF] Second Opinion Client User Manual 1.4.docx
These final sections cover additional controls for filtering detections and adjusting the image, which are standard features in this type of clinical software.
Quickly skim sections 5.2.11 ('Selective Display of Potentials Detections') and 5.2.12 ('How to Use Image Adjustment Controls'). These cover the pathology/non-pathology toggles and standard tools like brightness, contrast, and zoom.
These features allow you to:
- Toggle detection types: You can choose to hide all "Non-Pathology" findings (like existing restorations) to focus only on potential disease.
- Adjust the image: Just like in any standard radiography software, you can change the brightness/contrast, zoom in on a specific area, or invert the colors to better visualize certain structures. These are essential for your own expert review of the areas flagged by the AI.
Conclusion
In this lesson, we moved from theory to a practical, simulated walkthrough of an AI-assisted radiograph analysis. You've learned how a clinician interacts with a leading AI software tool, from opening a patient's file to actively analyzing the AI's detections.
Key Takeaways:
- Executing an AI analysis involves a workflow of image acquisition, automatic AI processing, and interactive clinical review.
- The user interface is typically composed of an image display pane, a filmstrip/image selector, and a list of AI-detected conditions.
- AI findings are presented with visual overlays (bounding boxes) that are color-coded to indicate the system's confidence level (e.g., high, medium, low).
- The Confidence Slider is a critical tool that allows you to filter detections by moving between a high-sensitivity view (showing all possible findings) and a high-specificity view (showing only the most certain findings).
Preview of the Next Lesson
You now know how to operate the interface. The next logical step is to deepen your understanding of what the outputs truly mean. In our next lesson, we will interpret common AI output elements within the software, such as highlighted findings and confidence scores. We will go beyond the color codes to discuss what a "probability score" represents and look at different types of outputs like bounding boxes and segmentation masks in more detail.