Introduction
Welcome to the final lesson in our module on portfolio foundations. In our last session, we explored the "why" of diversification by focusing on managing concentration and correlation risks. You learned that building a resilient portfolio involves more than just owning many assets; it requires owning assets that don't all move in the same direction.
Today, we'll address a critical follow-up question: How do we measure the riskiness of our portfolio? After all, in business, what gets measured gets managed. Your goal in this lesson is to learn how to calculate and interpret two of the most important metrics for quantifying portfolio risk: volatility and maximum drawdown.
Mastering these concepts is essential for your goal of personal wealth management. They provide a tangible way to assess if your portfolio's risk level aligns with your personal comfort zone and help you compare different investment strategies on a risk-adjusted basis.
Part 1: Portfolio Volatility – Measuring the Wiggles
Imagine two investment paths that both end up at the same 40% return. One is a smooth, steady climb. The other is a wild roller coaster with sharp upswings and terrifying drops. Which would you prefer to ride?
Most investors would choose the smoother path. The "wiggles" or "bumpiness" of the ride represent risk. In finance, we have a precise way to measure this: volatility. Volatility is the statistical measure of the dispersion of returns for a given security or market index. In simpler terms, it quantifies how much an investment's value fluctuates. It is most commonly measured by the standard deviation of its returns.
To begin, let's watch a video that provides an excellent intuitive and visual explanation of why we need to look beyond simple returns and measure these "wiggles."
The Sharpe Ratio Explained (by a quant trader)
The video 'The Sharpe Ratio Explained (by a quant trader)' from the Wall Street Quants channel starts by perfectly illustrating why return alone is a poor measure of performance. It introduces volatility as the key to understanding risk.
Please watch the following two segments: Why Returns Aren't Enough (00:35 - 02:43): Pay close attention to the comparison between the 'green' and 'black' investments. This section highlights the psychological pain and uncertainty associated with a volatile investment. Quantifying Risk with Volatility (02:43 - 03:57): This part introduces standard deviation (volatility) as the way to numerically measure the 'wiggles' in the return graph.
As the video explains, higher volatility means more uncertainty and a more stressful investment experience. It's the price you pay for returns, and you want to ensure that the price is reasonable.
Calculating Portfolio Volatility
Given your practical focus, let's look at exactly how to calculate this. While the mathematical formula involves variances and covariances, there's a much more direct way to calculate the volatility of your overall portfolio using a tool like Excel.
First, you would list the historical returns of your portfolio over a specific period (e.g., daily or monthly). Then, you simply use the standard deviation function.
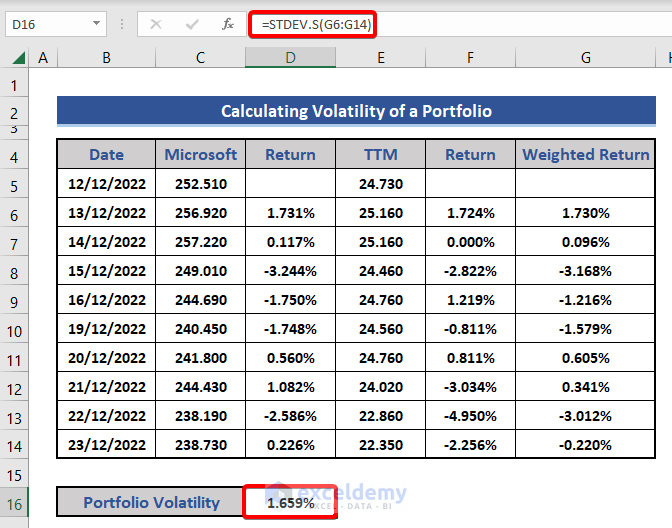
The following reading explains this straightforward method. You don't need to worry about the more complex variance-covariance matrix method also described; the direct approach is more efficient for our purposes.
How to calculate portfolio risk and return in Excel
The article 'How to calculate portfolio risk and return in Excel' from Initial Return provides a step-by-step guide. We will focus on the most direct method.
Please read the section titled 'A faster method.' This section shows how to calculate portfolio risk (volatility) by first calculating a time series of the portfolio's overall returns and then applying the STDEV.S function. This is the most practical workflow.
The result of this calculation gives you the portfolio's volatility for the period of your returns (e.g., daily or monthly). This figure is often annualized to make it comparable across different time frames.
Part 2: Maximum Drawdown – Measuring the Pain
While volatility measures the general bumpiness of the ride, maximum drawdown (Max DD) measures the single most painful drop. It is the largest percentage loss from a portfolio's peak value to its subsequent lowest point (trough) before a new peak is achieved.

Understanding your portfolio's potential maximum drawdown is arguably more important than understanding its volatility. This is because large drawdowns have a significant psychological impact that can lead investors to make poor decisions, like selling everything at the bottom out of fear. This resonates with your interest in psychology; the maximum drawdown is a direct measure of the potential for emotional distress in an investment strategy.
Let's watch a video that defines maximum drawdown and explains why it is so critical for investors to manage.
Maximum Drawdown: Risk Adjusted Return Series part 3
The video 'Maximum Drawdown: Risk Adjusted Return Series part 3' from Volatility Trading Strategies offers a clear and compelling look at this crucial risk metric.
Please watch the following three segments: What is Maximum Drawdown? (00:45 - 01:41): This provides a concise definition with a powerful real-world example from the 2008 financial crisis. The Math of Recovery (01:41 - 04:04): This is a vital concept. Notice how the gain required to break even grows exponentially as the loss increases. Preserving Emotional Capital (04:04 - 05:37): This section directly addresses the psychological toll of large drawdowns and how it impacts future decision-making.
Interpreting Maximum Drawdown
The video powerfully illustrates two key points:
- Mathematical Damage: A 50% loss requires a 100% gain just to get back to even. The deeper the hole, the harder it is to climb out.
- Psychological Damage: Experiencing a massive drop depletes your "emotional capital," making you more likely to abandon your strategy at the worst possible time.
So, what constitutes a "high" or "low" drawdown? While personal tolerance is key, some general benchmarks can be helpful.
How to Interpret and Limit the Drawdown of Your Trading Strategies ...
The article 'How to Interpret and Limit the Drawdown of Your Trading Strategies' provides some practical rules of thumb for evaluating drawdown percentages.
Please read the sections 'Why Is Drawdown So Important?' and 'How to Interpret Drawdown Data to Understand Whether a Strategy Is Efficient or Not' (focus on the 'Real Performance' part). This will give you context for what drawdown figures might mean in practice.
As the article suggests, a portfolio with a historical drawdown of under 10-15% might be considered low-risk, while one exceeding 30-40% would be considered high-risk. Your own tolerance for loss is what truly matters, but these figures provide a useful starting point for assessment.
Conclusion: Your Portfolio's Risk Dashboard
In this lesson, you've learned to quantify portfolio risk using two essential metrics. These are the key gauges on your investment dashboard.
Key Takeaways:
- Portfolio Volatility measures the "bumpiness" of your investment journey. It is calculated as the standard deviation of portfolio returns and gives you a sense of the uncertainty and day-to-day fluctuation you can expect.
- Maximum Drawdown measures the most severe peak-to-trough loss your portfolio has experienced. It is a crucial indicator of "worst-case" financial and psychological pain, highlighting the non-linear difficulty of recovering from large losses.
- Measurement is the first step to management. By calculating these metrics for your own portfolio (using historical data) or for a potential investment (like an ETF, which often reports these figures), you can make informed decisions that align with your personal risk tolerance.
This lesson concludes our foundational module on portfolio strategy. You now have a framework for defining your investment goals, structuring a diversified portfolio, and measuring its associated risks.
Next Up:
We will now shift our focus from the portfolio level to the individual security level. In the next module, "Decoding Financial Statements," we will begin our journey into fundamental analysis. You'll learn how to analyze a company's financial health and profitability, starting with how to read and interpret an income statement. This is the first step in developing a thesis for investing in a particular stock.