Hello! Welcome to your first lesson.
I'm your AI tutor, and I'll be guiding you through this course on low-frequency algorithmic trading for crypto assets. Your goal is to gain a practical understanding of momentum strategies, from theory and backtesting to implementation. Given your extensive background in theoretical physics, applied mathematics, and data engineering, we can dive deep into the quantitative and conceptual underpinnings of these topics.
This first module, "Foundations of Crypto LFT and Data Handling," will equip you with the fundamental tools and concepts needed to build and test trading strategies.
Today's lesson focuses on the very first learning outcome: Define momentum in financial markets from a quantitative perspective, contrasting it with mean-reversion. We will establish the core principles that drive trend-following strategies and differentiate them from their conceptual opposite.
Let's begin.
1. What is Momentum?
At its core, momentum is the empirical observation that assets that have performed well in the recent past tend to continue performing well, while assets that have performed poorly tend to continue performing poorly. It's often summarized by the adage, "winners keep winning, and losers keep losing."
From a quantitative trading perspective, this translates into a simple rule: buy past winners and (in a long/short portfolio) sell past losers.
To see this concept defined and illustrated, please watch the following segment from the video "Quantitative Momentum."
Quantitative Momentum: A Systematic Process to Identify High Momentum Stocks
This clip provides a clear, practical definition of momentum using a simple two-stock example and introduces the foundational academic research in the field.
Watch the sections from 04:56 to 07:22 and 11:58 to 14:45. Focus on how a momentum strategy selects stocks based on past returns and note the reference to the seminal 1993 paper by Jegadeesh and Titman, which established momentum as a significant market anomaly.
As you saw, the strategy involves ranking assets based on their performance over a specific lookback period (e.g., the past 12 months) and investing in the top performers. The academic work by Jegadeesh and Titman demonstrated that this simple strategy generated statistically significant excess returns, challenging the classical Efficient Market Hypothesis.
The persistence of this effect is striking. Let's look at the historical data.
Quantitative Momentum: A Systematic Process to Identify High Momentum Stocks
This next clip visualizes the long-term performance of momentum portfolios using data from Professor Ken French's highly respected data library.
Watch from 14:45 to 18:23. Pay close attention to the four lines on the graph: high momentum (winners), low momentum (losers), the S&P 500 (market), and the risk-free rate. Observe the dramatic divergence in performance over time.
The graph powerfully illustrates the momentum effect: a portfolio of high-momentum stocks substantially outperformed the market, while a portfolio of low-momentum stocks dramatically underperformed even risk-free assets. This provides the empirical motivation for building strategies around this phenomenon.
2. The Quantitative View: Momentum vs. Mean Reversion
Now, let's formalize these concepts. From a statistical standpoint, momentum and its counterpart, mean reversion, can be described using the concept of autocorrelation in asset returns.
- Momentum implies positive autocorrelation: high past returns are correlated with high future returns.
- Mean Reversion implies negative autocorrelation: high past returns are correlated with low future returns (and vice-versa), suggesting a "reversion to the mean."
The following reading provides a detailed breakdown of these definitions and their theoretical foundations.
Momentum and Mean Reversion Primer
This primer from Capital Flows Research, titled 'Momentum and Mean Reversion Primer,' offers a rigorous yet clear explanation of the two phenomena.
Please read the 'Introduction' and the section 'Momentum vs. Mean Reversion: Definitions and Foundations' (pages 1-3). Focus on how momentum is linked to investor underreaction and mean reversion to investor overreaction.
To put it simply, momentum strategies bet on the continuation of a trend, while mean-reversion strategies bet on its reversal.

The video below offers a concise, practical contrast between the two approaches.
Algo Trading Strategies: Momentum Trading (Complete Guide & Strategy)
This clip from Critical Trading's 'Algo Trading Strategies' series clearly articulates the opposing logic of momentum and mean-reversion trading.
Watch from 00:42 to 02:15. Note the simple but effective descriptions: momentum is 'buy high, sell higher,' while mean reversion is 'buy low, sell high.'
3. Time Horizons and Practical Nuances
An important insight from your reading is that momentum and mean reversion are not mutually exclusive; they often dominate at different time horizons.
- Short-Term (days to weeks): Mean reversion is often observed. This is sometimes called the "short-term reversal" effect. It can be caused by market-microstructure effects (e.g., liquidity providers pushing prices back to equilibrium) or overreactions to noise.
- Intermediate-Term (3-12 months): Momentum is the dominant effect. This is the timeframe most classic momentum strategies target.
- Long-Term (3-5 years): Mean reversion tends to reappear. Stocks that have been winners for several years may become overvalued and subsequently underperform.
The "Momentum and Mean Reversion Primer" you read earlier has an excellent section that details this. I recommend you review the section "Manifestation Across Different Timeframes" (pages 3-8) when you have time, as it provides a comprehensive overview of this crucial concept.
A Key Refinement: The "12-2" Rule
This time-horizon dependency leads to a key refinement in quantitative momentum strategies. Researchers found that excluding the most recent month's performance from the lookback period often improves results. This is because the short-term reversal effect can contaminate the intermediate-term momentum signal.
This leads to the common "12-2" or "12-1" convention: calculate momentum based on the returns from 12 months ago to 2 (or 1) months ago.
The following clip explains the rationale for this adjustment.
Quantitative Momentum: A Systematic Process to Identify High Momentum Stocks
Here, the speaker from the 'Quantitative Momentum' video addresses why the most recent month's data is often excluded from momentum calculations.
Watch from 18:23 to 22:49. The key takeaway is that one-month returns are often negatively correlated with future returns (short-term reversal), so including them can weaken the intermediate-term momentum signal.
4. Implications for Strategy Design
The fundamental differences between momentum and mean reversion lead to trading strategies with starkly different performance characteristics.
- Momentum Strategies typically have a win rate below 50%. They make money by capturing rare but very large wins when a strong trend persists, which more than offset the frequent small losses from failed trends. This results in a positively skewed return distribution.
- Mean Reversion Strategies typically have a high win rate. They profit by making many small, consistent gains as prices oscillate around a mean. However, they are vulnerable to rare but very large losses when a price breaks out of its range and begins a new, strong trend. This results in a negatively skewed return distribution.
This clip and the following chart illustrate this critical difference.
Algo Trading Strategies: Momentum Trading (Complete Guide & Strategy)
This final clip from 'Algo Trading Strategies' describes the typical profit distribution of a momentum strategy.
Watch from 07:53 to 09:04. Focus on the description of the return profile: more frequent small losses but occasional large profits.
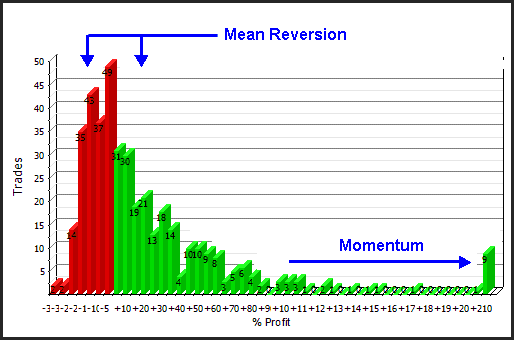
Understanding this distinction is vital for risk management and for aligning a strategy with your own psychological tolerance for frequent small losses versus rare large ones.
Conclusion
In this lesson, we have established a foundational understanding of momentum and contrasted it with mean reversion.
Key Takeaways:
- Momentum is the tendency for past winners to continue winning. Quantitatively, it is defined by positive autocorrelation in returns and is often measured over an intermediate-term lookback period (e.g., 3-12 months).
- Mean Reversion is the tendency for prices to revert to an average value after an extreme move. It is defined by negative autocorrelation in returns.
- These phenomena are driven by different behavioral biases: momentum is largely attributed to investor underreaction to news, while mean reversion is linked to investor overreaction.
- The dominance of momentum or mean reversion depends on the time horizon. Short-term returns often revert, intermediate-term returns trend, and long-term returns revert again.
- Strategies built on these principles have very different risk profiles: momentum strategies aim for large, infrequent wins (positive skew), while mean-reversion strategies aim for small, frequent wins (negative skew).
This conceptual framework is the starting point for everything that follows. In our next lesson, we will get more practical and address the learning outcome: "Calculate logarithmic and arithmetic returns for crypto assets and explain the implications of their statistical properties." We will move from the 'what' to the 'how' by focusing on returns—the fundamental building block for calculating momentum.